|
Promote the Economic Security of Workers and Families
Enforcing legal standards for workers' wages and working conditions,
providing unemployment compensation and other benefits when workers are unable
to work, and protecting retirement and health benefit security are central to
the DOL mission. Agencies supporting this strategic goal are the Employment and
Training Administration (ETA), the Employment Standards Administration (ESA),
the Employee Benefits Security Administration (EBSA), and the Pension Benefits
Guaranty Corporation (PBGC).
Outcome goals 2.1 and 2.2 contain six performance goals, of which two
were achieved, three were substantially achieved and one not achieved in FY
2005. The Department continued to improve worker protection and security, as
measured by union compliance, employee benefit plan enforcement and
administration of unemployment benefit and workers' compensation programs.
|
Outcome Goal 2.1 — Increase Compliance
With Worker Protection Laws
One performance goal achieved and one
substantially achieved |
FY 2005 Costs (millions) |
|
ESA Wage and Hour Division (05-2.1A) |
Goal achieved. Five targets reached. |
$214 |
|
ESA Office of Labor Management Standards (05-2.1B) |
Goal substantially achieved. One target reached and one
substantially reached. |
63 |
|
Outcome Goal 2.2 — Protect Worker
Benefits
One performance goal achieved, two substantially achieved
& one not achieved |
|
ETA Unemployment Insurance (05-2.2A) |
Goal substantially achieved. Three targets reached, one not
reached. |
$34,243 |
|
ESA Office of Worker Compensation Programs (05-2.2B) |
Goal substantially achieved. Nine targets reached, one not
reached. |
6131 |
|
EBSA Pension and Health Benefit Security (05-2.2C) |
Goal achieved. Four targets reached. |
160 |
|
PBGC Pension Plan customer satisfaction (05-2.2D)19 |
Goal not achieved. One target reached and one not reached.
|
— |
The following charts illustrate DOL's strategic goal net costs in FY
2005, with A Secure Workforce shares set apart. The first allocates total
Departmental costs of $49.912 billion; the second allocates an adjusted net
cost of $12.222 billion that excludes major non-discretionary items associated
with this goal.20 Net costs of this goal in FY
2004 (less Income Maintenance) were $1.383 billion.
The outcome goals and programs listed above, along with their results,
costs, and future challenges are discussed in more detail on the following
pages.
19Costs for this
goal are not included because the corporation's financial statements are
separate from those of the Department and are not included in this document.
20The excluded costs are referred to as Income Maintenance
– unemployment benefit payments to individuals who are laid off or out of
work and seeking employment ($31.488 billion) plus disability benefit payments
to individuals who suffered injury or illness on the job ($5.936 billion).
The Employment Standard Administration's (ESA) primary challenge is to
ensure that protections for workers keep pace with the changes occurring in the
American workforce, such as virtual workplaces, demographic shifts,
immigration, organized labor, the growth of small businesses, and the shift
from manufacturing to services. Under the Fair Labor Standards Act (FLSA), the
Migrant and Seasonal Agricultural Worker Protection Act, the Family and Medical
Leave Act, the Davis-Bacon Act (DBA) and the Service Contract Act, ESA's Wage
and Hour Division (WHD) administers standards for wages and working conditions
such as the minimum wage and overtime; child labor protections; field
sanitation standards in the agriculture industry; and prevailing wage
requirements on government contracts. The key to ensuring worker protections is
to focus on industries and employers with the most persistent and serious
violations; to quickly resolve employee complaints; and to ensure accuracy in
established wage rates. ESA's Office of Labor-Management Standards (OLMS)
ensures union transparency, financial integrity, and democracy by administering
and enforcing the Labor-Management Reporting and Disclosure Act (LMRDA). OLMS
responsibilities under the Act include compliance assistance; civil and
criminal investigations and enforcement; union compliance audits; and
reports/public disclosure administration. OLMS strategies are aimed at
improving timeliness and quality of union reports filed for public disclosure
and strengthening LMRDA compliance through union audits and outreach efforts.
|
Goal (Agency) and Statement
|
Performance Summary |
FY 2005 Costs (millions) |
|
05-2.1A (ESA)
American workplaces legally employ and compensate workers.
|
Goal achieved. All five targets reached. |
$214 |
|
05-2.1B (ESA)
Ensure union financial integrity, democracy and transparency.
|
Goal substantially achieved. One target reached, one substantially
reached. |
63 |
| The Wage and Hour Division’s PIECE
Plan initiative in Kansas City (Protecting Immigrant Employees with Compliance
and Education) provides immigrant workers who work as day laborers with
information about their rights under Federal labor standards laws. A key
component of this low-wage initiative is active community participation. One
such organization is the Westside Community Action Network (CAN), a community
policing and neighborhood organization that provides a drop-in center for day
laborers. Each month, an investigator from the Wage and Hour Kansas City
district office visits the Westside CAN to provide day laborers with basic
information on wage and hour protections. Between 20 to 40 day laborers at each
visit learn how to maintain records of the hours they work and how much they
were paid. The workers also learn how to identify their employer so that
appropriate remedies can be pursued when employers fail to pay. This initiative
has resulted in over 30 investigations of construction companies, restaurants,
and other low-wage industries. Back wages of over $250,000 have been collected
for 200 low-wage workers. |
 |
| Photo credit: DOL ESA |
Results Summary
WHD decreased the average number
of days to conclude a violation complaint and increased compliance of FLSA
prior violators. The DBA wage determination program improved wage determination
processing efficiency but experienced a slip from the FY 2004 level of
performance with respect to survey-based determinations. DOL did, however,
reach its target of issuing 81 percent of survey-based determinations within 60
days. OLMS established a baseline efficiency of union dollars protected per
staff day and the percentage of union reports meeting standards of
acceptability increased to 94 percent. Better union public disclosure reports
resulted from agency compliance assistance efforts and increasing use of
electronic reporting formats.
Net Cost of Programs
FY 2005 program costs of $277
million supported ESA's WHD and OLMS programs. As indicated by the chart, net
costs for these programs have been stable for the last few years. The drop from
FY 2002 to FY 2003 occurred because the Employee Benefits Security
Administration's performance goal was moved to Outcome Goal 2.2.
Future Challenges
For Wage and Hour programs, the
global economy ensures rapid change in ways that make enforcement more
difficult. Effective targeting of investigative resources requires close
monitoring of growth patterns. Increased immigration means greater potential
for violations because that population is most vulnerable. Finally, competitive
pressures limit employers' ability to cover the costs of compliance because
they have little influence on market prices. OLMS' continuing concern is
securing timely filed reports for unions' public disclosure. To address this
challenge, DOL supports amendment to the LMRDA to authorize civil monetary
penalties for late filing.
American workplaces legally employ and compensate workers.
Program Perspective
ESA's Wage and Hour Division
(WHD) enforces laws establishing minimum standards for wages and working
conditions. These include the minimum wage, overtime, youth employment
provisions of the Fair Labor Standards Act; the Migrant and Seasonal
Agricultural Worker Protection Act; and the Family and Medical Leave Act. WHD
is also responsible for enforcing field sanitation standards in agriculture and
the government contracts prevailing wage statutes, and administering the wage
determination provisions of the Davis-Bacon Act and the McNamara-O'Hara Service
Contract Act.
WHD's allocation of resources and performance indicators reflect the
keys to ensuring worker protections – focusing on industries and employers
with the most persistent and serious violations; resolving employee complaints
expeditiously and effectively; and ensuring that established wage rates are
accurate. By directing resources to compliance efforts in low-wage industries,
such as agriculture, construction and garment manufacturing, WHD seeks to
protect those low-wage workers most likely to be paid less than legally
required or to be employed in unsafe, illegal situations. WHD's efforts in this
regard have led to demonstrated successes over the years with increasing
compliance rates in industries like health care, garment manufacturing and
quick service restaurants. By reducing repeat violations, WHD can achieve
lasting compliance on behalf of many employees. WHD ensures responsiveness by
reducing the time it takes to resolve employee complaints and ensuring that the
resolution of violations promotes future compliance. Timely and accurate
prevailing wage determinations encourage efficiency and help ensure government
contract workers receive the wages to which they are entitled.
|
Indicators, Targets and Results |
FY 2004
Result |
FY 2005
Target |
FY 2005
Result
|
Target Reached* |
|
Average number of days to conclude a violation complaint.
|
189 |
187 |
178 |
Y |
|
Percent of prior violators who achieved and maintained FLSA
compliance following a full FLSA investigation. |
71% |
72% |
72% |
Y |
|
Percent of low-wage workers across identified low-wage industries
paid and employed in compliance with FLSA and MSPA. (Garment manufacturing)
|
N/A |
Establish
baseline |
So. CA 54%
NYC 76%
|
Y |
|
Number of wage determination data submission forms processed per
1000 hours |
1491 |
1506 |
1667 |
Y |
|
Percent of survey-based DBA wage determinations issued within 60
days of receipt of the underlying survey data. |
87% |
81% |
84% |
Y |
|
FY 2005 Costs |
$214 Million |
|
*Indicator target reached (Y), substantially reached (S) or not
reached (N) |
Goal Achieved |
A number of external factors influence WHD's program outcomes. As the
supply of and demand for vulnerable immigrant workers increases, the potential
for violations increases. Compliance levels in many low-wage industries are
also heavily influenced by competitive pressures and by subcontracting
arrangements in which smaller companies have little opportunity to influence
market prices.
Analysis and Future Plans
WHD established a FY 2005
target to reduce the number of days to resolve a violation complaint
and was successful in meeting that target. WHD will continue to follow
streamlined procedures to ensure early contact with complainants and
development of case facts to promote timely resolution of investigations.
In FY 2005, WHD completed its third statistically valid
investigation-based compliance survey of prior FLSA violators finding 72
percent of prior violators in compliance. The results improve on the FY 2004
measure of 71 percent. WHD is seeing the impact of recently employed strategies
such as investigation accountability standards, strategic use of penalties, and
effective publicity.
WHD's traditional measurements of compliance in low-wage industries have
been in garment manufacturing, health care and agriculture. In FY 2005, WHD saw
the percent of New York City garment workers employed in compliance increase
from 62 to 76 percent. In Southern California, the percent of garment workers
employed in compliance fell from 63 to 54 percent. The balance
of three strategies – compliance assistance; partnerships and
collaborative efforts; and enforcement promote long-term compliance in these
low-wage industries.
In FY 2006, WHD will undertake its first investigation-based compliance
survey in a broad cross section of low-wage industries. The survey will provide
WHD with a baseline measure of the percent of low-wage workers employed in
compliance with the FLSA. Future performance targets and measures of
improvements in the percent of low-wage employees employed in compliance will
be determined from the survey results. The results will lead to strategies for
addressing “off-the-clock” violations and will enhance WHD's Overtime
Security Enforcement Task Force efforts. WHD continues to work on upgrades in
information technology to see performance success in the wage determination
program.
Management Issues
Data used to report performance
against goals are derived largely from the WHD Investigative Support and
Reporting Database (WHISARD). A FY2004 independent analysis by the University
of Tennessee found 90 percent or greater consistency between WHISARD data and
case file information on 25 of 33 data elements used for performance reporting.
Another source of performance data is Wage Hour's statistically valid and
independently reviewed investigation-based compliance surveys. Wage
determination measures are derived from Automated Survey Data and Wage
Determination Generation Systems, manually and through the www.dol.gov Web
site.
WHD is monitoring legislative proposals that would expand the use of
compensatory time to the private sector and create a new temporary worker
program. If successful, both will impact WHD's employee complaint and low-wage
compliance goals.
WHD completed three program evaluations in FY 2005 focusing on the
agency's budget and performance integration and its compliance assistance
efforts. The first, Findings from Employers Pocket Guide on Youth
Employment: YouthRules! Telephone Survey, conducted by the private
research firm Westat (Study 15 in Appendix 2), found that while the publication
was deemed useful by readers, it was not relevant to many of the employers in
the census, as they do not employ young workers. In response, DOL is
encouraging WHD field offices to target employers with young workers. A second
evaluation, The Fair Labor Standards Act: Executive, Administrative, and
Professional Exemptions Seminar Evaluation, also conducted by Westat
(Study 16 in Appendix 2), found the seminar to be both informative and prompted
attendees to perform additional research on overtime security laws. Budget
and Performance Integration Model Evaluation, conducted by the private
research firm ICF Consulting (Study 17 in Appendix 2), found that WHD is well
on its way to successfully integrating budget and performance. The evaluation
also recommended that the integration will improve upon further use of
spreadsheet technology and all currently available data. WHD continues to
evaluate performance measures in low-wage industries, focusing on developing
models for common compliance strategies across low-wage industries. A second
evaluation of the agency's compliance assistance web information is
ongoing.
In 2003 a Program Assessment Rating Tool assessment of WHD's Davis Bacon
wage determination program found it did not demonstrate results and recommended
that WHD launch an external review; convene a work group to develop indicators
and targets; modify the wage survey or outreach strategies; and work with
stakeholders to identify appropriate regulatory, administrative, or statutory
reforms. In response, WHD developed goals and specific numeric targets to
ensure program performance improvements and contracted with a contractor to
evaluate the Davis-Bacon wage determination process.
Ensure union financial integrity, democracy, and
transparency
|
Indicators, Targets and Results |
FY 2004
Result |
FY 2005
Target |
FY 2005
Result
|
Target Reached* |
|
Union dollars protected per staff day |
N/A |
baseline |
$136,617 |
Y |
|
Percent of union reports meeting OLMS standards of acceptability
for public disclosure |
92% |
95% |
94% |
S |
|
FY 2005 Costs |
$63 Million |
|
*Indicator target reached (Y), substantially reached (S) or not
reached (N) |
Goal Substantially Achieved
|
Program Perspective
OLMS ensures union
transparency, financial integrity, and democracy by administering and enforcing
the Labor-Management Reporting and Disclosure Act (LMRDA). The Act requires
public disclosure reporting by unions and others; establishes standards for
union officer elections; and imposes criminal sanctions for embezzlement of
union funds. To implement the LMRDA protections, OLMS conducts criminal and
civil investigations, audits unions, and administers the Act's reporting and
public disclosure program.
Union transparency underpins the union democracy and financial integrity
objectives of the LMRDA and is a critical component of the OLMS program.
Therefore, a primary performance objective is to secure complete and accurate
union financial reports for public disclosure. Approximately 25 percent of OLMS
resources support the agency's Internet public disclosure system and a wide
range of compliance assistance, liaison, enforcement, and regulatory activities
to increase union transparency and LMRDA reporting compliance.
Enforcement of LMRDA union financial integrity protections is another
critical OLMS responsibility. A primary performance objective is to reduce
union fraud. Union audits and embezzlement investigations are key strategies
aligned with that effort. OLMS dedicates more than 50 percent of appropriated
resources annually to support a program of audits and criminal investigations
to protect the millions of dollars in dues paid by labor union members. OLMS
seeks efficiency and program impact in using audit resources to protect union
financial integrity. Therefore, the goal to increase union receipts protected
relative to staff resources expended on audits supplements the broader union
financial integrity goal to reduce union fraud.
| OLMS routinely responds to telephone and
written inquiries from union officers, employees, and members as well as the
general public about the rights of unionized American workers. But OLMS also
makes staff members available for in-person discussions. On May 17, 2005, the
United Food and Commercial Workers Union (UFCW) Local 555 sponsored an
informational meeting in Tigard, Oregon about compliance assistance. The
program included presentations and discussions about OLMS and the LMRDA, union
officer elections, financial recordkeeping, and locating compliance assistance
publications on the OLMS Web site. Twenty-eight members from 13 local unions
attended the sessions. The session demonstrated ESA’s commitment to a
dynamic compliance assistance program. OLMS will continue its outreach to help
ensure basic standards of democracy and fiscal responsibility within American
labor organizations. In this photo, UFCW member Sandy (left) discusses a
compliance assistance handout with OLMS representative Daphne. |
 |
| Photo credit: DOL ESA |
Analysis and Future Plans
Union Financial
Integrity
OLMS met its target to establish an efficiency measure
baseline. Union audits are an essential tool in discovering criminal, as well
as civil, violations of the LMRDA, and OLMS is dedicating resources to support
the conduct of an effective audit program. At the same time, OLMS seeks
efficiency in the use of union audit resources. In FY 2005, OLMS established a
baseline measurement of union receipts protected per staff day dedicated to
union audits: $136,617. In the future, OLMS will seek to increase the union
receipts protected per staff day to ensure effective use of resources and
program impact. OLMS also seeks to reduce the percentage of unions with
indicators of fraud to 7.5 percent in FY 2006. A visible union audit presence
and a strong criminal enforcement program are principal strategies in reducing
union fraud. An audit study to re-measure the union fraud level is planned for
FY 2006. For the study, an audit finding of a criminal LMRDA violation,
predominantly union funds embezzlement, will count as an indicator of
fraud.
Union Transparency
OLMS substantially reached its union
transparency target. Union transparency is critical to promoting union
democracy and financial integrity. Union reports meeting standards of
acceptability increased to 94 percent in FY 2005. This resulted from the
agency's continuing compliance assistance efforts and its increasing use of
electronic reporting formats, which include error checks and report validation
to help filers prepare complete and accurate reports. In FY 2006, OLMS will
seek to increase the compliance rate to 96 percent by continuing outreach and
compliance assistance efforts. Increased use of electronic reporting formats is
expected to continue.
Management Issues
Performance information for this
goal is derived from two agency data systems. The Case Data System includes
comprehensive information about OLMS investigations, audits, findings, and
subsequent enforcement actions. The labor organization report system (e.LORS)
includes information about the timeliness and sufficiency of union reports
filed under the LMRDA.
To report performance against DOL's union financial integrity goal, OLMS
measures indicators of union fraud. A baseline study in FY 2004 indicated a 9
percent incidence of fraud in unions. Although the level of fraud was not
re-measured in FY 2005, annual performance targets are in place and measurement
is again planned for FY 2006-2009. Maintaining effective union outreach, a
visible audit presence, and a strong criminal enforcement program are essential
to increasing union financial integrity. Timely, accurate union financial
reports are also essential. The completeness and accuracy of union reports are
markedly increasing as a result of compliance assistance efforts and the
increasing use of electronic report formats. Additionally, beginning in
September 2005 the largest reporting unions will begin to submit the required
LMRDA annual financial report on the recently revised LM-2 report form. The new
LM-2 form will significantly increase union transparency and promote union
financial integrity and democracy. In spite of comprehensive program efforts,
securing timely filed reports for public disclosure remains a continuing
challenge. To address this challenge, DOL supports amending the LMRDA to
authorize civil monetary penalties for late LMRDA filing.
DOL increases the economic security of America's working families by
protecting the benefits earned and promised to workers. Three DOL agencies and
one government corporation chaired by the Secretary of Labor – the
Employment and Training Administration (ETA), the Employment Standards
Administration (ESA), the Employee Benefits Security Administration (EBSA), and
the Pension Benefit Guaranty Corporation (PBGC) – administer payment of
temporary benefits for the unemployed; protect Federal workers from the
economic effects of work-related injuries and illness; protect employee
benefits plans against fraud and abuse; and insure pension payments.
ETA temporarily replaces the wages of the unemployed through the
Unemployment Insurance (UI) program, which provides grants to State-operated
programs and manages the Unemployment Trust Fund. ETA ensures that States'
programs are administered efficiently according to Federal standards and
requirements, and manages the trust fund to provide a buffer to volatile cycles
in tax revenues and benefit claims.
ESA protects Federal and certain other workers from the economic effects
of work-related injuries and illnesses through the Office of Workers'
Compensation Programs' (OWCP) four disability compensation programs. OWCP
provides wage replacement and cash benefits, medical treatment, vocational
rehabilitation, and other benefits to covered workers, their dependents and
survivors.
EBSA protects private employee pension plans, health plans and other
benefits plans against fraud and abuse by enforcing Title I of the Employee
Retirement Income Security Act of 1974, as amended (ERISA); through compliance
assistance, and through education. Where there has been malfeasance, EBSA
restores benefits and assets by bringing civil and criminal cases.
PBGC protects the pension benefits of participants in defined benefit
plans that have been terminated, usually due to the sponsoring employer's
bankruptcy, by serving as both insurer and administrator. As an insurer, PBGC
collects insurance premiums from employers that sponsor insured pension plans.
As an administrator, PBGC pays monthly retirement benefits to the participants
in terminated plans.
|
Goal (Agency) and Statement
|
Performance Summary |
FY 2005 Costs (millions) |
|
05-2.2A (ETA)
Make timely and accurate benefit payments to unemployed workers,
facilitate the reemployment of Unemployment Insurance claimants, and set up
Unemployment tax accounts promptly for new employers. |
Goal substantially achieved. Three targets reached, one
substantially reached. |
$34,243 |
|
05-2.2B (ESA)
Minimize the impact of work-related injuries. |
Goal substantially achieved. Nine targets reached, one not
reached. |
6131 |
|
05-2.2C (EBSA)
Enhance pension and health benefit security. |
Goal achieved. All four targets reached. |
160 |
|
05-2.2D (PBGC)21
Improve service to pension plan customers. |
Goal not achieved. One target reached and one not reached.
|
— |
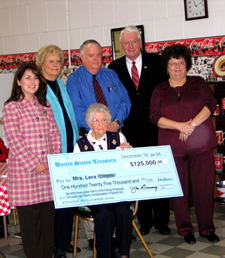
| When Lera of Flatwoods, Kentucky, was
presented a $125,000 check in recognition of her husband’s contribution to
our country’s security, she became the first recipient of compensation
under the new Part E program of the Energy Employees Occupational Illness
Compensation Program Act, which was amended in October 2004. The amendment pays
compensation and medical benefits to Department of Energy contractor and
subcontractor employees (or eligible survivors) who were harmed by exposure to
toxic substances at certain Department of Energy facilities. Lera’s
husband worked at the Paducah Gaseous Diffusion Plant between 1952 -77 and died
in 1986 of a lung disease. His widow, Lera is among hundreds of beneficiaries
who have been compensated under the new program, administered by OWCP. Kentucky
Senator Jim Bunning presented Lera with her check in December 2004, accompanied
by OWCP Cleveland District Director Annette Prindle, Lera’s son, James,
his wife Kay and Sandra (left to right). |
 |
| Photo credit: DOL ESA |
Results Summary
FY 2005 results were very good; 18
of 20 targets in this outcome goal were reached or substantially reached.
Generally, measured results were close to targets, with a few exceptions:
- ESA/OWCP's Energy Program Part B Final Decisions processing
timeliness was 96 percent vs. a target of 80 percent.
- EBSA's civil corrected to closed case ratio was 76 percent vs. a 66
percent target.
- EBSA received 10,325 applications for its Voluntary Compliance
programs against a target of 8340.
- PBGC's customer service score for practitioner callers was 68,
compared to a target of 72.
While the PBGC practitioner score is one point lower than in FY 2004 and
four points below the target, it is worth noting that PBGC scored higher than
other Federal agencies that collect payments. PBGC is considering whether to
adjust the target in future years.
Net Cost of Programs
FY 2005 program costs of
$40.534 billion supported ETA's unemployment insurance programs, ESA programs
to reduce the consequences of work-related injuries and EBSA efforts to ensure
that individuals receive promised benefits. PBGC is not included in the
Consolidated Statement of Net Costs, hence the cost of its programs is not
reflected here.
FY 2005 program costs decreased by approximately $6 billion, or 13
percent, from FY 2004. Unemployment Insurance program costs, which account for
$34.243 billion (84 percent) of FY 2005 costs for this outcome goal, dropped
due to a decrease in benefits paid — from $41.424 billion in FY 2004 to an
estimated $31.761 billion in FY 2005. UI Program costs are largely driven by
average weekly insured unemployment (AWIU) — the average number of people
filing claims for continuing UI benefits each week. The AWIU figure decreased
from 3.167 million in FY 2004 to an estimated 2.722 million in FY 2005.
Workers' compensation costs, which account for most of the remaining
costs of this goal ($6.131 billion, or 15 percent), rose from FY 2004 because
DOL assumed Part E of the Energy Employees Occupational Illness Compensation
program from the Department of Energy in FY 2005. With this responsibility came
a one-time increase in actuarial liability of $3.5 billion.
Future Challenges
To improve financial integrity of
the (very large) UI system, DOL is concentrating resources on reduction of
overpayments and reemployment of claimants via additional Reemployment and
Eligibility Assessments (REA) grants to assess UI beneficiaries' need for
reemployment services and their continued eligibility for benefits, and to
assure that beneficiaries understand that they must stop claiming benefits upon
their return to work. ESA's OWCP has just taken over Department of Energy
contract employees' claims processing; the agency is hiring staff and creating
systems and procedures to expedite assessment and payment of a backlog of
25,000 claims. PBGC is concerned about adequate funding of existing pension
plans, and DOL included in the President's FY 2006 Budget to Congress a
proposal to strengthen plan funding rules, improve transparency, and reform the
premium structure for defined benefit plans.
21PBGC is not
included in the Consolidated Statement of Net Costs, hence the costs of its
programs are not reflected here.
Make timely and accurate benefit payments to unemployed workers,
facilitate the reemployment of Unemployment Insurance (UI) claimants, and set
up unemployment tax accounts promptly for new employers.
|
Indicators, Targets and Results |
FY 2004
Result |
FY 2005
Target |
FY 2005
Result
|
Target Reached* |
|
Percent of all intrastate first payments made within 21 days
|
88.7% |
89.9% |
90%** |
Y |
|
Percent of the amount of estimated detectable/recoverable
overpayments that the States establish for recovery |
57.4% |
59.5% |
59%** |
S |
|
Percent of new employer liability determinations made within 90
days of the end of the first quarter in which liability occurred |
83.6% |
82.4% |
83%** |
Y |
|
Efficiency: Quality-weighted base initial claims per $1,000 of
inflation-adjusted base grant funds |
N/A |
8.55 |
8.60** |
Y |
|
FY 2005 Costs |
$34,243 Million |
|
*Indicator target reached (Y), substantially reached (S) or not
reached (N)
** Estimated. |
Goal Substantially Achieved
|
Program Perspective
The Federal-State Unemployment Insurance (UI) system ameliorates personal financial hardship due to
unemployment by temporarily replacing part of lost wages. UI also stabilizes the economy during economic
downturns. For both workers and employers, the program's success depends upon: timely payment of benefits,
prevention or prompt detection of erroneous payments, quickly establishing new employers' tax accounts to ensure
workers' wages are reported and tax payments to fund benefits are made, and promoting and facilitating benefit
recipients' return to suitable work. States operate their own programs under State laws which must conform to
Federal law. As the Federal partner, DOL provides program leadership, allocates administrative funds, provides
technical assistance, exercises performance oversight, and ensures that States meet requirements of Federal UI laws
and regulations. Measuring efficiency and effectiveness of States' administrative operations is an important aspect of
program management.
Economic conditions and the
resulting program workloads affect many aspects of UI performance. For example,
when unemployment rises, more claims are filed; UI payment timeliness generally
declines; and efficiency tends to decrease. On the other hand, slower creation
of new businesses reduces the number of new employer tax accounts, and the
timeliness of tax liability determinations generally goes up. In addition,
external factors such as natural disasters could have a negative affect on UI
performance. Performance targets are based on the Administration's current
economic assumptions.
Analysis and Future Plans
The UI system performed
extremely well, aided by improving economic conditions. Over the year, the
number of beneficiaries declined by about 10 percent to 7.9 million. States
improved first payment timeliness to the targeted level, maintained new
employer status determinations timeliness at above the targeted level, and
improved detection of overpayments. The effects of the Florida hurricanes in
early FY 2004 are estimated to have reduced aggregate first payment timeliness
by 0.2 percentage points.
DOL continues to improve UI payment integrity by providing funds for
States to implement data exchanges with the Social Security Administration
(SSA) to identify false and stolen numbers; access data from other State
agencies to verify personally identifying information; and gain access to the
National Directory of New Hires, an additional tool for swiftly detecting and
preventing payments to claimants who have returned to work. For FY 2006,
targets for all indicators will be raised. The UI Program continues to
demonstrate improved efficiency as evidenced by the result exceeding the FY
2005 target. The Department promoted efficiency through competitive grants for
automation and remote systems (e.g., telephone and Internet claims-taking). To
date, lack of data has precluded measuring the extent that the UI system is
meeting the goal of facilitating UI claimants' reemployment. In 2006, States
will begin gathering data for a UI reemployment indicator and a performance
target will be set.
Text
only
| Texas Workforce Commission (TWC)
toughened work verification of its Unemployment Insurance (UI) claimants. Texas
is a national leader in UI work search requirements, insisting on a minimum of
three work search contacts per week. Since February 2004, TWC has required
1,000 randomly selected claimants per week to submit their work search logs for
the commission's verification. UI-funded employees throughout the agency,
including the TWC Executive Director, make weekly calls to employers to verify
claimants' work search activity. In addition, TWC's Division of Program
Integrity conducts investigations and provides local law enforcement agencies
with information to prosecute fraudulent claims. TWC also works with the Texas
Office of Attorney General comparing data from its New Hire Cross-match system
to identify claimants who have returned to work. These initiatives have
significantly reduced UI overpayments in Texas. |
 |
| Photo credit: Larry Temple, Brooks Myers
and James Johnson |
Management Issues
The Office of Inspector General
(OIG) expressed concern that the UI overpayment data collected by the Benefit
Accuracy Measurement (BAM) unit reflected little improvement in the UI
overpayment rates over the past several years. In FY 2004, the OIG listed
reducing improper payments and improving the integrity and solvency of the UI
program among DOL's top management challenges. In addition to funding identity
theft prevention activities and New Hires crossmatches, the Department has
promulgated a State-level detection of overpayments core measure with a
performance criterion, giving States an added incentive to prevent and detect
overpayments. One roadblock to the effectiveness of these tools is the lack of
trained State staff to investigate all potential overpayments. The 2006 budget
contains a legislative proposal — the Integrity Act — designed to
give States the means to obtain funding for integrity activities, including
staff, to enhance recovery and prevent overpayments.
To reduce overpayments and facilitate reemployment, DOL awarded
Reemployment and Eligibility Assessments (REA) grants to 21 States during FY
2005. The grants have been used to conduct in-person claimant interviews in
One-Stop Career Centers to assess UI beneficiaries' need for reemployment
services and their continued eligibility for benefits, and to ensure that
beneficiaries understand that they must stop claiming benefits upon their
return to work. The FY 2006 budget request includes funding to continue this
effort and to combat identity theft.
In recent years, UI trust fund solvency has been another major
management challenge. Borrowing from the UI trust fund by States has declined
since last year, and significant portions of previously borrowed amounts have
been repaid. Due in part to improved economic conditions, most States' trust
fund accounts had a positive cash flow over the last 12 months, and overall,
the funds are more solvent than last year. DOL requested that the OIG review
Internal Revenue Service administration charges because of past overcharges.
The Government Accountability Office (GAO) released Better Data
Needed to Assess Reemployment Services to Claimants in June 2005 (Study 18
in Appendix 2). The report recommended that DOL collect more comprehensive
information on reemployment services used by UI claimants and their outcomes.
DOL will be collecting additional data that, combined with currently collected
data, provide adequate information to guide policies promoting the reemployment
of UI beneficiaries.
The GAO issued another report, Unemployment Insurance Information on
Benefit Receipt (Study 19 in Appendix 2), in March 2005. GAO analyzed the
data and information on UI benefits and UI recipients in the past two decades,
but offered no recommendations.
The Program Assessment Rating Tool review of the UI program rated it
Moderately Effective. Recommendations, which included simplifying performance
measures, funding New Hire crossmatch and focusing resources on reemployment
through REA's, have been implemented.
Minimize impact of work-related injuries
|
Indicators, Targets and Results |
FY 2004
Result |
FY 2005
Target |
FY 2005
Result
|
Target Reached* |
|
Lost production days rate (LPD per 100 employees) for Federal
Employees' Compensation Act (FECA) cases of the United States Postal Service
|
147.2 |
148 |
135 |
Y |
|
Lost production days rate (LPD per 100 employees) for FECA cases
of All Other Government Agencies |
61.9 |
61 |
56 |
Y |
|
Produce compensation benefit savings in the FECA program through
the use of Periodic Roll Management |
$24.4 million |
$17 million |
$21 million |
Y |
|
The rate of change in the indexed cost per case of FECA cases
receiving medical treatment remains below the nationwide health care cost trend
|
+2.4%
vs +8.8% |
Trend
+8.1% |
+2.8% |
Y |
|
Targets for five communications performance areas |
4 targets |
3 targets |
3 targets |
Y |
|
Average time required to resolve disputed issues in Longshore and
Harbor Worker's Compensation Program contested cases |
247 |
245 |
254 |
N |
|
Average percent of Black Lung benefit claims for which, following
an eligibility decision by the district director, there are no requests for
further action pending one year after the claim is filed |
82.2% |
76.5% |
80.6% |
Y |
|
Percent of initial claims for benefits in the Part B Energy
Program processed within standard timeframes |
92% |
80% |
80% |
Y |
|
Percent of Final Decisions in the Part B Energy Program processed
within standard timeframes |
99% |
80% |
94.7% |
Y |
|
Pay compensation benefits to 1200 claimants under Part E by the
end of the Fiscal Year |
N/A |
1200 |
1525 |
Y |
|
FY 2005 Costs |
$6131 Million |
|
*Indicator target reached (Y), substantially reached (S) or not
reached (N) |
Goal Substantially Achieved
|
Program Perspective
DOL protects Federal and
certain other workers, their dependents and survivors from the economic effects
of work-related injuries and illnesses by providing wage replacement and cash
benefits, medical treatment, vocational rehabilitation and other benefits
through four disability compensation programs:
| Roxann’s career as a correctional
officer for a Colorado Federal prison came to a violent end in 1999 when she
was attacked by an inmate. But her working life didn’t end there. With the
help of an Office of Worker Compensation Programs’ rehabilitation
counselor, regular contacts with a rehabilitation specialist and the oversight
of a claims examiner, Roxann eventually earned an associate’s degree in
graphic design and a 3.9 grade point to go with it. She even won a competition
sponsored by the Pueblo Colorado Housing Authority, which adopted her graphic
design as its official logo. OWCP next helped Roxann identify potential
employers and coached her on interview skills. Their teamwork paid off. Through
an OWCP reemployment initiative which reimburses new employers 50 percent of
rehabilitated workers’ initial wages, Roxann found a place to hang her
diploma at an area sign shop, where she continues working today. |
 |
| Photo credit: Elsie Sandoval |
- Federal Employees' Compensation for civilian Federal workers;
- Longshore and Harbor Workers' Compensation for private-sector
maritime workers;
- Black Lung Benefits program for coal miners;
- Energy Employees Occupational Illness Compensation (EEOIC) for
nuclear weapons employees of the Department of Energy or its contractors.
The Office of Workers' Compensation Programs (OWCP) adjudicates claims;
mediates disputes; makes benefit payments; helps with injury recovery and
return to work; controls costs; and offers technical and customer services.
Program results are influenced by how effectively resources are deployed to
these activities. Ten indicators reflect the outcome objectives of OWCP's key
mission strategies. Quality Case Management success in FECA is measured as
reductions in lost production days (LPD) rates. Communications goals seek to
improve customer access to program information and raise service responsiveness
and quality levels. Ensuring claims processing efficiency is central to the
objectives of the EEOIC program. Effective mediation of disputes and improved
decision quality are measured in the Black Lung and Longshore programs.
Financial integrity of the FECA Compensation Fund is the objective of
beneficiary roll reviews and medical benefit cost control.
OWCP program goals are impacted by several external factors. FECA and
EEOIC are continually challenged by large numbers of cases. Economic and
workplace trends change the nature of new injuries and job availability for
workers ready to return to duty. For the Longshore program, the potential for
greater security threats on American facilities and an increasing volume of War
Hazard Act claims require additional planning and resource investment. Medical
costs continue to push higher as technology expands and the use of medicines
and treatment procedures increase. While business practices become increasingly
automated and customer demands for information and assistance grow more
sophisticated and accelerated, OWCP capabilities remain limited, and
communications are costly.
Analysis and Future Plans
Fulfilling DOL's
commitment to injured workers is measured by the ten indicators. The results
discussion is organized into three categories: Return-to-Work, Reducing Program
Expenses and Customer Service.
Returning Injured Employees to Work
Return-to-work
outcomes are expressed as reductions in average Lost Production Days. The FY
2005 results for the USPS and All Other Government LPD rates show significant
reductions due primarily to fewer FECA wage-loss disability days paid this
year. Overall new FECA cases created were down by nearly 8 percent, which is
consistent with a reduction in wage-loss paid. However, the results may also
reflect the implementation of FECA's new automated claims system (beginning
January 2005) that temporarily slowed receipt and processing of wage-loss
claims and may have depressed the number of lost production days counted for
these measures. A major strategy supporting DOL's LPD goals continued to be
Quality Case Management in the FECA program which has saved approximately
$50,000,000 in compensation costs annually. DOL also continued its leadership
of the OWCP/OSHA Safety, Health and Return-to-Employment (SHARE) initiative, in
its second of three years in FY 2005. Under SHARE, Federal agencies have set
individual goals to reduce on-the-job injury rates, speed notification of
injuries to DOL, and reduce lost production day rates. The initiative
challenges DOL to assist the agencies in those efforts.
Text
only
Reducing Program Expenses
DOL workers' compensation
outcomes can also be measured in financial terms, as these outcomes reflect the
efficiency and quality of our benefit payment activities, the impact of case
management and benefit services, and the utilization of administrative
resources to produce those outcomes.
Periodic Roll Management (PRM) generates benefit cost savings through
careful review of cases to determine if continued disability status is
warranted, and to determine the reemployment potential of those currently
receiving compensation. Through PRM, DOL has saved over $1 billion since FY
1999, and DOL intends to continue this goal into the future. DOL reached its
target by producing $21 million in savings in FY 2005.
DOL also reached its target of keeping the inflation of Federal
Employees' Compensation Act (FECA) medical costs below the national rate of
health care inflation, as measured by the Milliman USA Health Cost Index. In
the past year, the rate of increase in average FECA medical benefit payments
rose by only 2.8 percent — well below the national average as reported by
Milliman for this year and all recent years. This success results from several
administrative steps DOL has taken in recent years (centralized bill
processing, strengthened review of treatment authorization requests, fee
schedules and stronger automated edits and other controls). In the long term,
the rate of growth in average FECA medical case costs has consistently remained
below the growth rate in nationwide costs as measured by the Milliman USA,
Health Cost Index. Against that index, FECA has saved nearly $40 million
annually in medical treatment costs since FY 2000.
Customer Service
OWCP met its Communications goal by
reaching three of the five sub-targets, including increased use of electronic
services, reducing average caller wait times, and meeting call handling quality
standards. OWCP did not reach its target to reduce the time required to resolve
disputed issues in Longshore and Harbor Workers' Program contested cases.
Disputed issues were resolved, on average, in 254 days against a target of 245
days. There are several reasons for this. First, a higher proportion of
disputed cases required referral to the Office of Administrative Law Judges for
formal hearings, which increases overall processing time. Second, a correction
of coding inconsistencies in some district offices resulted in a slight
increase in the average days to resolve disputes at the district office level.
In FY 2006, DOL will re-baseline this indicator, add two new disputed case
categories (attorney fees and successive employer liability), and revise the
target level, while continuing to emphasize swift resolution of Longshore case
disputes.
OWCP reached its target to reduce requests for further action following
Black Lung benefit eligibility decisions (for claims subject to revised
regulations). Performance for this indicator was 80.6 percent, against a target
76.5 percent. The revised regulations for Black Lung benefit claims were
designed to produce faster and fairer final benefit determinations without
changing eligibility requirements. The result has been an increase in the
number of stakeholders who accept the district director's initial decision and
decide not to pursue the claim further. Out-year workload projections for the
next ten years are also being reviewed in a program evaluation recommended
during Black Lung's PART assessment. In addition, the Program is completing a
two-year review of all Part B Claims; the first systematic review these claims
have received since initial approval by Social Security Administration.
DOL reached its targets for processing timeliness in the Energy Part B
program. This program processed 80 percent of initial claims and 94.7 percent
of final decisions within standard time frames, against targets of 80 percent
for both indicators. DOL also exceeded its target to make 1,200 payments under
the new Part E program during FY 2005. In FY 2006, DOL plans to incorporate the
processing of new Part E claims in the timeliness indicators and to add a new
indicator to significantly reduce the unadjudicated inventory of claims
transferred from the DOE under Part E.
Management Issues
Performance data are extracted
from OWCP's automated case management and benefit payment systems, internal
managerial audits or other reviews. OWCP maintains strict oversight of data
entry, with regular on-site review by district directors and periodic reviews
that assess data quality. The OIG has identified the Black Lung Disability
Trust Fund indebtedness as a major management challenge for the Department, and
DOL is seeking Congressional sponsorship of a legislative proposal to eliminate
the debt. In addition, DOL has developed a legislative proposal which would
build return-to-work incentives into the Federal Employees' Compensation
Act.
OWCP and OSHA are in the second year of the SHARE initiative, directed
at improving Federal agency performance in returning their injured employees to
work. SHARE has generated intense interest among the agencies and their
progress is being noted in SHARE reports.
In October 2004 Congress transferred benefit coverage to DOL from the
Department of Energy for DOE contract employees who became ill from exposure to
toxic substances. This component of the program is referred to as “Part
E.” DOL has moved quickly to hire new staff and process more than 25,000
DOE claims.
Participation with audits of the Department's Office of Inspector
General and other outside auditing agencies is a significant activity for OWCP.
These studies generally examine OWCP compliance with legal and administrative
requirements; impact of new program mandates; management effectiveness; program
performance and results; data integrity and systems compliance; legislative and
Governmental administrative impacts; and comparison to and OWCP impact on other
programs.
Two GAO audits were completed in FY 2005: Limited Information
is Available on the Number of Civilians Exposed in Vietnam and Their Workers'
Compensation Claims ; and Defense Base Act Insurance: Review Needed of
Cost and Implementation Issues (see Studies 20 and 21 in Appendix 2).
The FECA and Black Lung Programs have received PART ratings of
Moderately Effective and both continue to implement PART recommendations.
Enhance Pension and Health Benefit Security
|
Indicators, Targets and Results |
FY 2004
Result |
FY 2005
Target |
FY 2005
Result
|
Target Reached* |
|
Ratio of closed civil cases with corrected violations to civil
cases closed |
69% |
66% |
76% |
Y |
|
Ratio of criminal cases referred for prosecution to total criminal
cases |
45% |
37.7% |
45% |
Y |
|
Customer Satisfaction Index for participants and beneficiaries who
have contacted EBSA for assistance |
62 |
63 |
67 |
Y |
|
Voluntary Compliance Programs (Applications) |
NA |
8,340 |
14,082 |
Y |
|
FY 2005 Costs |
$160 Million |
|
*Indicator target reached (Y), substantially reached (S) or not
reached (N) |
Goal Achieved |
Program Perspective
EBSA is responsible for
enforcing the Employee Retirement Income Security Act (ERISA), and the main
challenge is to maintain trust and confidence in the employee benefits system.
By achieving successful civil and criminal case closure and referral rates, DOL
shows its success in targeting wrongdoers. DOL also combines an aggressive
outreach and education program with a highly motivated and trained staff of
customer assistance experts in the field of pension and health laws. By
directly assisting plan participants and beneficiaries in understanding their
rights and protecting their benefits, we help workers monitor their own benefit
rights.
EBSA oversees benefit security for nearly seven million plans, 150
million participants and beneficiaries, and in excess of $4.5 trillion in
assets with a relatively modest budget of $131 million dollars and
approximately 880 FTE to achieve its performance goal of enhancing pension and
health benefit security. Externalities, such as the economy and tax policy,
have a significant impact on whether employers opt to offer benefits, and
whether employees choose to participate and to what extent.
| An Edison, New Jersey company filed for
bankruptcy protection and terminated approximately 950 employees. As a result,
the company began liquidating its assets. However, after months of waiting, the
workers never received their 401(k) plan distributions. The Department
investigated a complaint and the company admitted it had not distributed the
benefits. After the Department’s intervention, the company began
distributing benefits which ultimately totaled in excess of $3.7
million. |
Analysis and Future Plans
DOL achieved its goal to
Enhance Pension and Health Benefit Security. In addition to meeting its
criminal case, civil case, customer service and voluntary compliance targets,
DOL obtained monetary results of over $1.6 billion – the second highest in
agency history. Monetary results are a product of EBSA's investigative and
participant assistance activities. DOL investigated a number of high profile,
resource intensive cases with far reaching effects on the participant benefits
community. Benefit Advisors responded to over 99 percent of all written
inquiries within 30 days of receipt and responded to over 99 percent of
telephone inquiries by the close of the next business day.
Text
only
Text
only
Text
only
Text
only
In addition to long-term targets for civil and criminal ratios, we have
added annual targets to reflect success with respect to national enforcement
initiatives, which may change from year-to-year based on strategic priorities.
EBSA worked with The Gallup Organization (Gallup) to refine the long-term
target for their customer service satisfaction index consistent with other
industry standards and experience. EBSA also added an internal compliance
assistance measure that will demonstrate success in voluntary compliance
programs such as the Voluntary Fiduciary Correction Program and their
Delinquent Filer Voluntary Compliance Program.
| Over a four-year period, an employee of
an Atlanta-area investment adviser, entrusted with safeguarding the investment
and management of employee benefit plans, is alleged to have stolen in excess
of $5.4 million from numerous employee benefit plans. The stolen funds were
allegedly used to take personal vacations, acquire vacation real estate, and to
purchase extensive collections of wine, art, jewelry and other expensive home
furnishings. To conceal her alleged theft, she occasionally used assets stolen
from one plan to temporarily fund another plan and then prepared and
distributed false account information to plan trustees and participants. As a
result of an EBSA investigation, the employee was indicted with various wire
fraud, theft, money laundering and embezzlement charges. |
Management Issues
EBSA's Enforcement Management
System (EMS) provides the data used to measure the enforcement ratios. EMS and
EBSA continually receive high marks for data integrity and quality. EBSA's
quality assurance processes require that individuals not directly involved with
the investigation at hand approve all case openings. Cases with monetary
results receive several levels of scrutiny including national office oversight
and review. Additionally, EBSA uses a peer review method to conduct quality
assurance reviews on randomly selected closed cases. In the participant
assistance area, Gallup performed the evaluation and provided the customer
satisfaction score. The voluntary correction program data is maintained in the
EMS and the Delinquent Filer Voluntary Compliance tracking system.
EBSA has acted on recommendations from its PART assessments in FY 2004
and FY 2005 by conducting evaluations and regulatory reviews. DOL contracted
with Gallup to evaluate EBSA's participant assistance program (Study 22 in
Appendix 2). EBSA was provided detailed performance information that helped
improve their customer satisfaction score. In addition, with Gallup's
assistance, EBSA conducted targeted training to address employee weaknesses and
share best practices. Finally, field offices developed plans to continue
improving their customer satisfaction scores. In FY 2006, Gallup will perform a
follow-up study of EBSA's participant assistance program. As noted in Appendix
2, GAO published a report in June 2005, Government Actions Could Improve
the Timeliness and Content of Form 5500 Pension Information (Study 24 in
Appendix 2). EBSA and PBGC are working with IRS to collect pension plan
information more efficiently through electronic filing. EBSA has established a
regulatory review program that sets forth a process for identifying initiatives
for review; provides for cost and benefit evaluation of identified regulations
and exemptions; and explores modifying or eliminating those rules for which
costs and administrative burdens outweigh benefits. In EBSA Should Mandate
Electronic Filing Of the Form 5500 to Improve Data Accuracy (Study 23 in
Appendix 2), the Office of Inspector General (OIG) recommends that mandating
electronic filing will improve the collection of employee benefit plan
information. EBSA concurs with OIG's recommendation and has issued a Notice of
Proposed Regulation in the Federal Register to require electronic filing.
Improve service to pension plan customers.
|
Indicators, Targets and Results |
FY 2004
Result |
FY 2005
Target |
FY 2005
Result
|
Target Reached* |
|
Customer Satisfaction score for practitioner callers |
69 |
72 |
68 |
N |
|
Customer Satisfaction score for responding to trusteed plan
participants' inquiries |
78 |
78 |
79 |
Y |
|
FY 2005 Costs22 |
— |
|
*Indicator target reached (Y), substantially reached (S) or not
reached (N) |
Goal Not Achieved |
Program Perspective
The Secretary of Labor chairs
the Pension Benefit Guaranty Corporation's Board of Directors, and PBGC
protects the retirement incomes of 44.4 million American workers in 31,200
defined benefit pension plans. As insurer, PBGC monitors the financial health
of defined benefit plans, minimizing risk of loss to the insurance program, to
pension plans and to participants. When underfunded plans terminate, PBGC must
trustee them and assume responsibility for paying benefits. PBGC is currently
monitoring some 4,152 active plans with underfunding approaching $74.3
billion.
PBGC is now the trustee of nearly 3,500 defined benefit plans that have
failed since 1974, and provides timely and uninterrupted payment of pension
benefits to over 600,000 participants. In 2005, PBGC assumed responsibility for
an additional 270,000 plan participants, increasing the total number of
participants for which PBGC is responsible for current and future pension
benefits to over 1.5 million. A large influx of customers with service demands
puts a strain on their ability to handle the workload and improve service.
Providing exceptional service is an important part of PBGC's mission.
PBGC's efforts are measured by the American Customer Satisfaction Index
(ACSI), from which PBGC receives useful information about its customers'
expectations and needs. PBGC improves processes and adjusts performance targets
to achieve or exceed benchmark results and meet growing customer
expectations.
As a customer-focused agency, PBGC allocates resources to provide
exceptional service to customers and stakeholders. Approximately seventy-eight
percent of funds are allocated to serving participants, while twenty-two
percent are used to provide services to plan sponsors and pension
practitioners. PBGC chose the practitioner and participant performance
indicators to help identify areas for improving quality of service provided to
customers. To assess its effectiveness, PBGC uses the ACSI survey methodology,
which provides comparisons to both private businesses and the federal
government.
Analysis and Future Plans
Practitioner
Performance Indicator
PBGC did not achieve the target for practitioner
callers. PBGC has made substantial improvements in services to this customer
group that should be reflected in higher customer service figures. For example,
PBGC now offers online filing of premium payments through its self-service
system called My Plan Administration Account (My PAA), which enables improved
data accuracy and easier filing preparation. In addition, practitioners can now
file financial information electronically through PBGC's e-4010 application.
PBGC has also released a redesigned Web site in 2005, www.pbgc.gov, which
significantly improved site navigation enabling pension practitioners and the
media to quickly find information and guidance. While the overall rating for
practitioners dropped one point to 68, it remains higher than other Federal
agencies with similar financial collection responsibilities. Notable customer
service improvements include increased scores in both ease of reaching the
right person and making premium refunds timely and accurate. PBGC continues to
examine ways to improve customer service and increase efficiency. Efforts are
already underway to overhaul the premium accounting system, further empowering
customers to interact electronically with the PBGC.
Participant Performance Indicator
PBGC achieved an ACSI
score of 79 for participants in trusteed plans, exceeding the target of 78.
This is one point higher than its 2004 score of 78 and seven points higher than
the 2004 national ACSI of 72 for the Federal government. By using the ACSI,
PBGC can identify the service elements that have a greater impact on customer
satisfaction. For example, PBGC experienced a significant increase in
accuracy of resolution in 2005 over the previous three years, due to
a continued focus on resolving customers' concerns quickly and accurately.
In 2005, PBGC expanded online business transactions for participants. In
addition to making address changes and requesting electronic funds deposit,
participants who access their benefit accounts electronically through the
Web-based My Pension Benefit Account (My PBA) can now apply for benefits,
designate a beneficiary and submit a request for a benefit estimate.
Text
only
Management Issues
PBGC achieved a score of 79 and
was evaluated as Moderately Effective through the PART. To respond to PART
recommendations, PBGC doubled its efforts to work closely with DOL, Treasury
and other executive branch agencies to develop a comprehensive pension reform
proposal. The proposal focuses on strengthening plan funding rules, improving
transparency, and reforming the premium structure for defined benefit plans.
Pension reform was included in the President's FY 2006 Budget to Congress. As
noted in Appendix 2, GAO published a report in June 2005, Government
Actions Could Improve the Timeliness and Content of Form 5500 Pension
Information (Study 24 in Appendix 2). PBGC and EBSA are working with IRS
to collect pension plan information more efficiently through electronic
filing.
In 2005, PBGC restructured its organization to focus more on managing
risks and minimizing losses for the insurance program. Newly created offices
will increase PBGC's effectiveness in identifying troubled plans and assisting
their sponsors in complying with funding requirements. A steady workload
increase resulting from newly terminated plans with large numbers of
participants continues to present PBGC with challenges. Despite that, providing
exceptional service to customers remains a key goal at PBGC. Constant upgrades
to technology will enable PBGC to provide better and faster service to
participants. For example, PBGC began implementing a customer relationship
management system to track customer interactions from the telephone, e-mail,
fax, incoming and outgoing correspondence, and Web-based transactions. All
these efforts are expected to yield positive results over the next cycles of
improvement and evaluation.
22PBGC is not
included in the Consolidated Statement of Net Costs, hence the costs of its
programs are not reflected here.
|