

 / Climate Monitoring / 2007 / ENSO / Help / Climate Monitoring / 2007 / ENSO / Help
Use these links to access detailed analyses of Global and U.S. data. 
|
|
La Niña conditions intensified in December as Sea Surface Temperature (SST) anomalies remained significantly below normal across the equatorial Pacific basin and atmospheric conditions reflected a strengthening of the cold event.
In the Niño 3.4 index region of the central Pacific, the SST anomaly decreased to a monthly averaged value of -1.32°C (-2.38°F), a cooling of 0.05°C (0.09°F) compared with the November value. In the eastern equatorial Pacific and along the South American coast, below normal ocean surface and mixed-layer temperatures also persisted in December. For the month, the SST anomaly in the Niño 1+2 region was -2.04°C (-3.67°F, ) making it the tenth consecutive month with cooler-than-normal SSTs in this region. In the western tropical Pacific, SSTs were also below normal in December, although they warmed slightly from the previous month. The anomaly in the Niño 4 region was -0.73°C (-1.31°F) in December, which was a slight warming of 0.08°C (1.14°F) from the November anomaly. Atmospheric conditions in December intensified and became more indicative of an ENSO cold phase (La Niña). Specifically, the Outgoing Longwave Radiation (OLR) index increased signficantly to a positive monthly value of +2.2, and the Southern Oscillation Index (SOI) reached its highest value of the 2007/2008 La Niña event, increasing to +1.8 for the month — the fifth consecutive month with a positive SOI value. Therefore, all of the oceanic and atmospheric indicators reflected the persistence and slight intensification of moderate La Niña conditions in December. KEYWORDS: ENSO; Niño Regions; Southern Oscillation Index (SOI); Kelvin Waves; Thermocline; Sea-Surface Temperatures (SSTs); Madden-Julian Oscillation (MJO); Walker Circulation |
 December
SOI REACHES ITS HIGHEST VALUE OF THE COLD EVENT

Larger image of December SSTs 
Larger image of December Sub-Surface Temperatures 
Larger image of December SST Anomalies 
Larger image of 3-month (Oct-Dec) averaged SST Anomalies |
Sea-Surface Temperatures (SSTs) and
Mixed-Layer Conditions:
Equatorial Pacific Ocean surface and subsurface temperatures have been cooler-than-average over the past several months as a La Niña event developed and reached maturity. The cold anomalies persisted in December as the SSTs decreased across the central equatorial Pacific region. Water temperatures in the upper ocean also remained below normal, with an area of -2.0°C (-4.4°F) and cooler temperature anomalies in the mixed-layer in the central and eastern equatorial Pacific. Warmer-than-average upper ocean temperatures remained in the far western equatorial Pacific this month, primarily west of the Date Line. For the month, the SST anomaly in the Niño 3.4 Index region was -1.32°C (-2.38°F), which was a decrease of 0.05°C (0.09°F) compared to the November value. The SSTs in the Niño 4 Index region of the western equatorial Pacific were also below normal in December, with an anomaly of -0.73°C (-1.31°F) for the month (map of Niño regions). For the most recent global ocean surface temperatures, please see the loop of satellite-derived weekly SST anomalies for December 2007. The cooling of the SST anomalies in the Niño 3.4 index region over the past several months kept the 3-month running mean below -0.5°C (-0.9°F) in December, which is the Oceanic Niño Index (ONI) threshold for a cold event (NOTE: For NOAA's official ENSO classification scheme, please see NOAA's El Niño/La Niña Index Definition). The NOAA Climate Prediction Center's most recent ENSO Diagnostic Discussion indicated that ENSO remained in a moderate cold phase (La Niña), while the latest ENSO Wrap-Up from the Australian Bureau of Meteorology (BoM) concurred that La Niña conditions had intensified in the equatorial Pacific basin during December. Both CPC and the BoM have indicated that the La Niña will persist over the next several months, into the Boreal spring. |

Larger image of December Zonal Winds 
Larger image of 9 December 2007 Pacific Sea Level Anomalies 
Larger image of 9 December 2007 Global Sea Level Anomalies |
Equatorial Zonal Winds (U-Component Winds) and Sea-Level Topography:
The easterly Trade winds were stronger-than-normal across the western part of the equatorial Pacific during December. The above normal easterly winds along the equatorial zone increased upwelling of colder water in the mixed-layer, which intensified the below normal SST anomalies. The above normal easterly winds along the equatorial zone were especially evident in the western Pacific region, where monthly anomalies reached over 4 m/s (9 mph), while in the eastern equatorial Pacific the Trade winds were near-normal. Significant week-to-week variability in the near-surface winds has been observed along the equatorial region of the Pacific, as shown in the animation of December zonal winds. Stronger-than-normal easterly winds occurred across the far western Pacific region in mid- to late-December. Pacific sea levels measured by the NASA/JPL Jason-1 satellite remained significantly below average across the equatorial Pacific in December. The most recent satellite overpass measured a broad area of negative sea level anomalies in the central and eastern equatorial Pacific, which reflect the cooler-than-normal ocean surface and mixed-layer temperatures along the equator (see the 9 December 2007 Pacific sea level anomalies). |
 Larger image of December OLR Anomalies Larger image of December OLR Anomalies Larger image of September-December OLR Anomalies Larger image of September-December OLR Anomalies Larger image of December OLR Index Larger image of December OLR Index |
Outgoing Longwave Radiation (OLR):
The map to the left shows the spatial pattern of global OLR (in W m-2) measured by satellite during December. An area of positive OLR anomalies was observed in the western Pacific along the equator, which extended eastward into the central Pacific along the Inter-Tropical Convergence Zone (ITCZ). Positive OLR anomalies were also observed over the past 3 months (October-December), with a broad area of suppressed tropical convection in the equatorial zone from the western Pacific to the South American coast. The persistence of positive OLR anomalies in the equatorial Pacific region is a typical atmospheric signal associated with La Niña conditions, and a reduction of deep tropical convection due to cooler SSTs in this region. The monthly OLR index increased signficantly in December, reaching a value of +2.2 W m-2 (averaged across an area in the western Pacific near the Date Line between 160° E and 160° W); an increase of 1.4 from the November value. This brought the OLR index to its highest value of the cold event, and was the tenth consecutive month with a positive OLR index value. Note: high frequency variability in OLR is typically associated with the Madden-Julian Oscillation (MJO), which is an intra-seasonal oscillation in convective activity that propagates west to east in the near-equatorial region from the Indian Ocean into the Pacific Ocean approximately every 30-60 days. The latest MJO activity can be seen in CPC's graphs of Daily MJO Indices. |
 Larger image of December SOI |
Southern Oscillation Index (SOI): The standardized value of the SOI was +1.8 in December, which was the highest SOI of the 2007/2008 La Niña so far. Overall, December was the fifth consecutive month with a positive index value [consistently positive (negative) values of the SOI are typical of La Niña (El Niño) conditions]. Therefore, the persistence of positive monthly SOI values over the past several months, as well as the increase in the SOI in December, indicates that the La Niña has entered its mature phase across the equatorial Pacific basin. |
November
SSTs CONTINUE TO COOL ACROSS THE EQUATORIAL PACIFIC

Larger image of November SSTs 
Larger image of November Sub-Surface Temperatures 
Larger image of November SST Anomalies 
Larger image of 3-month (Sep-Nov) averaged SST Anomalies |
Sea-Surface Temperatures (SSTs) and
Mixed-Layer Conditions:
Equatorial Pacific Ocean surface and subsurface temperatures have been cooler-than-average over the past several months, due to the development of a La Niña event. The observed cooling trend continued in November as the SST anomalies continued to decrease across the entire equatorial Pacific region. Water temperatures in the upper ocean also remained below normal, with an area of -2.0°C (-4.4°F) and cooler temperature anomalies in the mixed-layer in the central and eastern equatorial Pacific. Warmer-than-average upper ocean temperatures remained in the far western equatorial Pacific, west of the Date Line in November. For the month, the SST anomaly in the Niño 3.4 Index region was -1.27°C (-2.29°F), which was a decrease of -0.20°C (-0.36°F) compared to the October value. The SSTs in the Niño 4 Index region of the western equatorial Pacific were also below normal in November, with an anomaly of -0.81°C (-1.46°F) for the month (map of Niño regions). For the most recent global ocean surface temperatures, please see the loop of satellite-derived weekly SST anomalies for November 2007. The cooling of the SST anomalies in the Niño 3.4 index region over the past several months kept the 3-month running mean below -0.5°C (-0.9°F) in November, which is the Oceanic Niño Index (ONI) threshold for a cold event (NOTE: For NOAA's official ENSO classification scheme, please see NOAA's El Niño/La Niña Index Definition). The NOAA Climate Prediction Center's most recent ENSO Diagnostic Discussion indicated that ENSO continued to be in a cold phase (La Niña), while the latest ENSO Wrap-Up from the Australian Bureau of Meteorology (BoM) concurred that La Niña conditions were present in the equatorial Pacific basin. Both CPC and the BoM have indicated that the La Niña will persist over the next several months, at least into early 2008. |

Larger image of November Zonal Winds 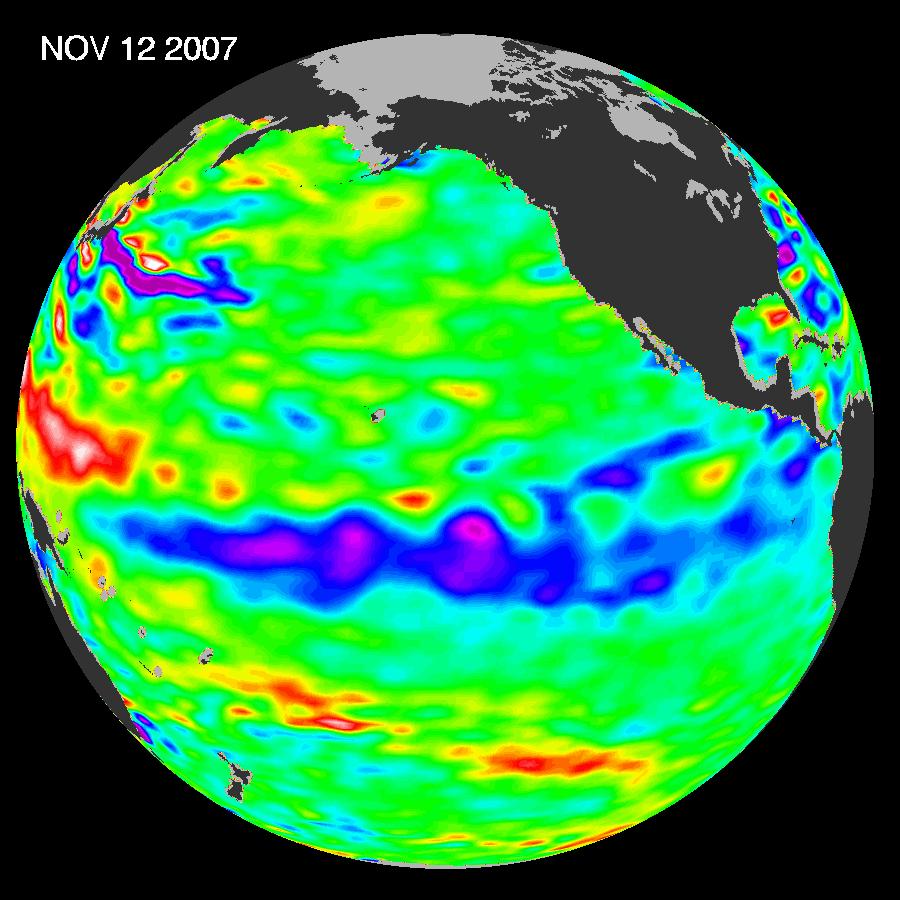
Larger image of 12 November 2007 Pacific Sea Level Anomalies 
Larger image of 12 November 2007 Global Sea Level Anomalies |
Equatorial Zonal Winds (U-Component Winds) and Sea-Level Topography:
The easterly Trade winds were stronger-than-normal across most of the tropical Pacific during November. The above normal easterly winds along the equatorial zone increased upwelling of colder water in the mixed-layer, which maintained the below normal SST anomalies. The above normal easterly winds along the equatorial zone were especially evident in the western Pacific region, while in the eastern equatorial Pacific the Trade winds were slightly above normal. Significant week-to-week variability in the near-surface winds has been observed along the equatorial region of the Pacific, as shown in the animation of November zonal winds. Stronger-than-normal easterly winds occurred across the far western Pacific region in early-November, but these weakened significantly later in the month. Pacific sea levels measured by the NASA/JPL Jason-1 satellite remained significantly below average across the equatorial Pacific in November. The mid-November satellite overpass measured a broad area of negative sea level anomalies, which reflect the cooler-than-normal ocean surface and mixed-layer temperatures along the equator (see the most recent image of 12 November 2007 Pacific sea level anomalies). |
 Larger image of November OLR Anomalies Larger image of November OLR Anomalies Larger image of September-November OLR Anomalies Larger image of September-November OLR Anomalies Larger image of November OLR Index Larger image of November OLR Index |
Outgoing Longwave Radiation (OLR):
The map to the left shows the spatial pattern of global OLR (in W m-2) measured by satellite during November. An area of positive OLR anomalies was observed in the western Pacific just north of the equator along the Inter-Tropical Convergence Zone (ITCZ). Positive OLR anomalies were also observed over the past 3 months (September-November), with a broad area of suppressed tropical convection north of the equator from the western Pacific to the South American coast. The persistence of positive OLR anomalies in the equatorial Pacific region is a typical atmospheric signal associated with La Niña conditions, and is associated with a reduction of deep tropical convection due to cooler SSTs in this region. The monthly OLR index for November was +0.8 W m-2, averaged across an area in the western Pacific near the Date Line between 160° E and 160° W. This was a decrease of -0.6 from the October value. Despite the slight decrease in the OLR index, the November value was the tenth consecutive month with a positive OLR index value, which is consistent with La Niña conditions. Note: high frequency variability in OLR is typically associated with the Madden-Julian Oscillation (MJO), which is an intra-seasonal oscillation in convective activity that propagates west to east in the near-equatorial region from the Indian Ocean into the Pacific Ocean approximately every 30-60 days. The latest MJO activity can be seen in CPC's graphs of Daily MJO Indices. |
 Larger image of November SOI |
Southern Oscillation Index (SOI): The standardized value of the SOI was +0.9 in November. Despite a brief excursion to a negative SOI in July (-0.5), five of the past six months have had positive index values [consistently positive (negative) values of the SOI are typical of La Niña (El Niño) conditions]. Therefore, the persistence of positive monthly SOI values over the past several months, as well as the increase in the SOI in November, indicates the development of a La Niña sea level pressure pattern across the equatorial Pacific basin. |
October
SSTs CONTINUE TO COOL ACROSS EQUATORIAL PACIFIC

Larger image of October SSTs 
Larger image of October Sub-Surface Temperatures 
Larger image of October SST Anomalies 
Larger image of 3-month (August-October) averaged SST Anomalies |
Sea-Surface Temperatures (SSTs) and
Mixed-Layer Conditions:
Equatorial Pacific Ocean surface and subsurface temperatures have been cooler-than-average over the past several months, as ENSO was in transition from a neutral to a cold phase. The observed cooling trend continued in October, as the SST anomalies decreased across the entire equatorial Pacific basin. Water temperatures in the mixed-layer also remained below normal, with an area of -3.0°C (-4.4°F) and cooler temperature anomalies between 50-200 meters depth in the central and eastern equatorial Pacific. Warmer-than-average upper ocean temperatures remained in the far western equatorial Pacific west of the Date Line in October. For the month, the SST anomaly in the Niño 3.4 Index region was -1.07°C (-1.93°F), which was a decrease of -0.20°C (-0.36°F) compared to the September value. The SSTs in the Niño 4 Index region of the western equatorial Pacific were also below normal in October, with a monthly anomaly of 0.47°C (0.85°F) below the mean (map of Niño regions). For the most recent global ocean surface temperatures, please see the loop of satellite-derived weekly SST anomalies for October 2007. The cooling of the SST anomalies in the Niño 3.4 index region over the past several months kept the 3-month running mean below -0.5°C (-0.9°F) in October, which is the Oceanic Niño Index (ONI) threshold for a cold event (NOTE: For NOAA's official ENSO classification scheme, please see NOAA's El Niño/La Niña Index Definition). The NOAA Climate Prediction Center's most recent ENSO Diagnostic Discussion indicated that ENSO was officially in a cold phase (La Niña), while the latest ENSO Wrap-Up from the Australian Bureau of Meteorology (BoM) concurred that La Niña conditions were present in the equatorial Pacific basin. Both CPC and the BoM have indicated that the La Niña will persist over the next several months, at least into early 2008. |

Larger image of October Zonal Winds 
Larger image of 16 October 2007 Pacific Sea Level Anomalies 
Larger image of 16 October 2007 Global Sea Level Anomalies |
Equatorial Zonal Winds (U-Component Winds) and Sea-Level Topography:
The easterly Trade winds were above normal across most of the tropical Pacific during October. The above normal easterly winds along the equatorial zone increased upwelling in the mixed-layer, which was especially evident in the central Pacific region. Slightly weaker than normal Trade winds were observed in the eastern equatorial Pacific. Significant week-to-week variability in the near-surface winds has been observed along the equatorial region of the Pacific, as shown in the animation of October zonal winds. Periods of anomalous westerly winds occurred across parts of the western Pacific region in early October, and in the eastern Pacific region later in the month. Pacific sea levels measured by the NASA/JPL Jason-1 satellite remained significantly below average across the equatorial Pacific in October. The mid-October overpass measured a broad area of negative sea level anomalies, which reflected the cooler-than-normal ocean surface and mixed-layer temperatures along the equator (see the most recent image of 16 October 2007 Pacific sea level anomalies). The negative sea level anomalies expanded significantly along the equatorial zone, as the cold SST anomalies intensified in October. |
 Larger image of October OLR Anomalies Larger image of October OLR Anomalies Larger image of August-October OLR Anomalies Larger image of August-October OLR Anomalies Larger image of October OLR Index Larger image of October OLR Index |
Outgoing Longwave Radiation (OLR):
The map to the left shows the spatial pattern of global OLR (in W m-2) measured by satellite during October. An area of positive OLR anomalies was observed across the entire Pacific basin just north of the equator along the Inter-Tropical Convergence Zone (ITCZ). Positive OLR anomalies were also observed over the past 3 months (August-October), with a broad area of suppressed tropical convection north of the equator from the western Pacific to the South American coast. The persistence of positive OLR anomalies in the Pacific equatorial region is a common atmospheric signal associated with La Niña conditions. The monthly OLR index for October was +1.4 W m-2, averaged across an area in the western Pacific near the Date Line between 160° E and 160° W. This was an increase of +0.8 from the September value. The persistence of positive OLR index values is also consistent with La Niña conditions. Note: high frequency variability in OLR is typically associated with the Madden-Julian Oscillation (MJO), which is an intra-seasonal oscillation in convective activity that propagates west to east in the near-equatorial region from the Indian Ocean into the Pacific Ocean approximately every 30-60 days. The latest MJO activity can be seen in CPC's graphs of Daily MJO Indices. |
 Larger image of October SOI |
Southern Oscillation Index (SOI): The standardized value of the SOI was +0.6 in October. Despite a brief excursion to a negative SOI in July (-0.5), four of the past five months have had positive index values [consistently positive (negative) values of the SOI are typical of La Niña (El Niño) conditions]. Therefore, the persistence of positive monthly SOI values over the past several months indicates the development of a La Niña sea level pressure pattern across the equatorial Pacific basin. |
September
SSTs CONTINUE TO COOL ACROSS EQUATORIAL PACIFIC

Larger image of September SSTs 
Larger image of September Sub-Surface Temperatures 
Larger image of September SST Anomalies 
Larger image of 3-month (July-September) averaged SST Anomalies |
Sea-Surface Temperatures (SSTs) and
Mixed-Layer Conditions:
Equatorial Pacific Ocean surface and subsurface temperatures have been near or slightly cooler-than-average over the past six months, as ENSO was in transition from a neutral to a cold phase. However, during the past several months the SSTs decreased across the entire equatorial Pacific region, and this trend continued in September. Water temperatures in the mixed-layer remained below normal, with an area of -2.0°C (-3.6°F) and cooler temperature anomalies between 50-200 meters depth in the central and eastern equatorial Pacific. Warmer-than-average upper ocean temperatures remained in the far western equatorial Pacific west of the Date Line in September. For the month, the SST anomaly in the Niño 3.4 Index region was -0.87°C (-1.57°F), which was a decrease of -0.14°C (-0.25°F) compared to the August value. The SSTs in the Niño 4 Index region of the western equatorial Pacific also decreased in September, which resulted in a monthly anomaly of 0.47°C (0.85°F) below the mean (map of Niño regions). For the most recent global ocean surface temperatures, please see the loop of satellite-derived weekly SST anomalies for September 2007. The cooling of the SST anomalies in the Niño 3.4 index region over the past several months decreased the 3-month running mean below the long-term average during September. (NOTE: For NOAA's official ENSO classification scheme, please see NOAA's El Niño/La Niña Index Definition). The NOAA Climate Prediction Center's most recent ENSO Diagnostic Discussion indicated that ENSO was in a cold phase (La Niña), while the latest ENSO Wrap-Up from the Australian Bureau of Meteorology (BoM) concurred that La Niña conditions had developed in the equatorial Pacific basin. Both CPC and the BoM have indicated that the La Niña will persist over the next several months, at least into early 2008. |

Larger image of September Zonal Winds 
Larger image of 10 September 2007 Pacific Sea Level Anomalies 
Larger image of 10 September 2007 Global Sea Level Anomalies |
Equatorial Zonal Winds (U-Component Winds) and Sea-Level Topography:
The easterly Trade winds were above normal across most of the tropical Pacific during September. The above normal easterly winds along the equatorial zone increased upwelling in the mixed-layer, which was especially evident in the central Pacific region. Slightly weaker than normal Trade winds were observed in the far western equatorial Pacific. Significant week-to-week variability in the near-surface winds has been observed along the equatorial region of the Pacific, as shown in the animation of September zonal winds. Periods of anomalous westerly winds occurred across parts of the far western Pacific region during late September, as the Trade winds weakened over Indonesia and New Guinea. Pacific sea levels measured by the NASA/JPL Jason-1 satellite remained significantly below average across the equatorial Pacific in September. The negative sea level anomalies reflected the below normal ocean surface and mixed-layer temperatures along the equator (see the most recent image of 10 September 2007 Pacific sea level anomalies). The negative sea level anomalies expanded significantly along the equatorial zone, as the cold SST anomalies intensified in September. |
 Larger image of September OLR Anomalies Larger image of September OLR Anomalies Larger image of July-September OLR Anomalies Larger image of July-September OLR Anomalies Larger image of September OLR Index Larger image of September OLR Index |
Outgoing Longwave Radiation (OLR):
The map to the left shows the spatial pattern of global OLR (in W m-2) measured by satellite during September. An area of positive OLR anomalies was observed across the eastern and central Pacific just north of the equator along the Inter-Tropical Convergence Zone (ITCZ). Positive OLR anomalies were also observed over the past 3 months (July-September), with a broad area of suppressed tropical convection north of the equator from the western Pacific to the South American coast. The persistence of positive OLR anomalies in the Pacific equatorial region is a common atmospheric signal associated with La Niña conditions. The monthly OLR index for September was +0.8 W m-2, averaged across an area in the western Pacific near the Date Line between 160° E and 160° W. This was a slight increase from the August value of +0.6. The persistence of positive OLR index values is consistent with La Niña conditions. Note: high frequency variability in OLR is typically associated with the Madden-Julian Oscillation (MJO), which is an intra-seasonal oscillation in convective activity that propagates west to east in the near-equatorial region from the Indian Ocean into the Pacific Ocean approximately every 30-60 days. The latest MJO activity can be seen in CPC's graphs of Daily MJO Indices. |
 Larger image of September SOI |
Southern Oscillation Index (SOI): The standardized value of the SOI was +0.2 in September. Despite a brief excursion to a negative SOI in July (-0.5), three of the past four months have had positive index values [consistently positive (negative) values of the SOI are typical of La Niña (El Niño) conditions]. Therefore, the recent shift to a positive SOI was indicative of a La Niña sea level pressure pattern across the equatorial Pacific basin. |
August
SSTs COOL ACROSS EQUATORIAL PACIFIC

Larger image of August SSTs 
Larger image of August Sub-Surface Temperatures 
Larger image of August SST Anomalies 
Larger image of 3-month (June-August) averaged SST Anomalies |
Sea-Surface Temperatures (SSTs) and
Mixed-Layer Conditions:
Equatorial Pacific Ocean surface and subsurface temperatures have been near or slightly cooler-than-average over the past several months, as the phase of ENSO was neutral. However, during August the SSTs decreased across the entire equatorial Pacific region. In addition, water temperatures in the mixed-layer remained below normal, with an area of -2.0°C (-3.6°F) and cooler temperature anomalies between 50-200 meters depth in the central and eastern equatorial Pacific. Warmer-than-average upper ocean temperatures remained in the far western equatorial Pacific west of the Date Line in August. For the month, the SST anomaly in the Niño 3.4 Index region was -0.73°C (-1.31°F), which was a decrease of -0.44°C (-0.79°F) compared to the July value. The SSTs in the Niño 4 Index region of the western equatorial Pacific also decreased in August, which resulted in a monthly anomaly of 0.11°C (0.19°F) below the mean (map of Niño regions). For the most recent global ocean surface temperatures, please see the loop of satellite-derived weekly SST anomalies for August 2007. The cooling of the SST anomalies in the Niño 3.4 index region over the past several months decreased the 3-month running mean below the long-term average during August. (NOTE: For NOAA's official ENSO classification scheme, please see NOAA's El Niño/La Niña Index Definition). The NOAA Climate Prediction Center's most recent ENSO Diagnostic Discussion indicated that the current phase of ENSO was in a transition from neutral conditions to a cold phase (La Niña), while the latest ENSO Update from the Australian Bureau of Meteorology (BoM) also reflected the transition to La Niña conditions in the equatorial Pacific basin. Both CPC and the BoM have indicated that this transition to La Niña will continue over the next 1-3 months (see the Australian BoM ENSO Wrap-Up). |

Larger image of August Zonal Winds 
Larger image of 26 August 2007 Pacific Sea Level Anomalies 
Larger image of 26 August 2007 Global Sea Level Anomalies |
Equatorial Zonal Winds (U-Component Winds) and Sea-Level Topography:
The easterly Trade winds were above normal across most of the tropical Pacific during August. The above normal easterly winds along the equatorial zone increased upwelling in the mixed-layer, which was especially evident in the central Pacific region. Slightly weaker than normal Trade winds were observed along the South American coast and in the far western equatorial Pacific this past month. Significant week-to-week variability in the near-surface winds has been observed along the equatorial region of the Pacific, as shown in the animation of August zonal winds. Periods of anomalous westerly winds occurred across parts of the far eastern Pacific region during mid-August, as the Trade winds weakened off the South American coast. Pacific sea levels measured by the NASA/JPL Jason-1 satellite remained significantly below average across the equatorial Pacific in August. The negative sea level anomalies reflected the below normal ocean surface and mixed-layer temperatures along the equator (see the most recent image of 26 August 2007 Pacific sea level anomalies). The negative sea level anomalies expanded significantly along the equatorial zone, as the cold SST anomalies intensified in August. |
 Larger image of August OLR Anomalies Larger image of August OLR Anomalies Larger image of June-August OLR Anomalies Larger image of June-August OLR Anomalies Larger image of August OLR Index Larger image of August OLR Index |
Outgoing Longwave Radiation (OLR):
The map to the left shows the spatial pattern of global OLR (in W m-2) measured by satellite during August. An area of positive OLR anomalies was observed in the eastern Pacific just north of the equator along the Inter-Tropical Convergence Zone (ITCZ). Positive OLR anomalies were also observed over the past 3 months (June-August) as well, with a broad area of suppressed tropical convection from the western Pacific to the South American coast. The persistence of positive OLR anomalies along the equatorial zone in the Pacific is a common signal associated with La Niña conditions. The monthly OLR index for August was +0.6 W m-2 averaged across an area in the western Pacific near the Date Line between 160° E and 160° W. This was a slight decrease from the July value of +1.1, although it remained positive and consistent with a transition from a neutral phase to cold event (La Niña) conditions. Note: high frequency variability in OLR is typically associated with the Madden-Julian Oscillation (MJO), which is an intra-seasonal oscillation in convective activity that propagates west to east in the near-equatorial region from the Indian Ocean into the Pacific Ocean approximately every 30-60 days. The latest MJO activity can be seen in CPC's graphs of Daily MJO Indices. |
 Larger image of August SOI |
Southern Oscillation Index (SOI): The standardized value of the SOI was +0.1 in August. Despite a brief excursion to a negative SOI in July (-0.5), two of the past three months have had positive index values [consistently positive (negative) values of the SOI are typical of La Niña (El Niño) conditions]. Over the past six months, the SOI was inconsistent with the other atmospheric and oceanic indicators, as it remained mostly negative. However, the shift to a positive index in August was indicative of a transition in the sea level pressure pattern across the equatorial Pacific basin. |
July
COOLING SSTs INDICATE THE POSSIBLE DEVELOPMENT OF LA NIÑA

Larger image of July SSTs 
Larger image of July Sub-Surface Temperatures 
Larger image of July SST Anomalies 
Larger image of 3-month (May-July) averaged SST Anomalies |
Sea-Surface Temperatures (SSTs) and
Mixed-Layer Conditions:
Equatorial Pacific Ocean surface and subsurface temperatures have been near or slightly cooler-than-average over the past several months, as the phase of ENSO was neutral. During July, the SSTs decreased across the equatorial Pacific region, as a weak Kelvin wave propagated across the basin. Water temperatures in the mixed-layer remained below normal, with an area of -2.0°C (-3.6°F) and cooler temperature anomalies between 100-200 meters depth in the central and eastern equatorial Pacific. Warmer-than-average upper ocean temperatures remained in the far western equatorial Pacific west of the Date Line in July. For the month, the SST anomaly in the Niño 3.4 Index region was -0.29°C (-0.52°F), which was a decrease of -0.38°C (-0.68°F) compared to the June value. The SSTs in the Niño 4 Index region of the western equatorial Pacific also decreased slightly during July, which resulted in a monthly anomaly of 0.05°C (0.09°F) above the mean (map of Niño regions). For the most recent global ocean surface temperatures, please see the loop of satellite-derived weekly SST anomalies for July 2007. The cooling of the SST anomalies in the Niño 3.4 index region over the past several months decreased the 3-month running mean below the long-term average during July. (NOTE: For NOAA's official ENSO classification scheme, please see NOAA's El Niño/La Niña Index Definition). The NOAA Climate Prediction Center's most recent ENSO Diagnostic Discussion indicated that the current phase of ENSO was neutral, while the latest ENSO update from the Australian Bureau of Meteorology (BoM) also reflected the ENSO-neutral conditions in the equatorial Pacific basin. Both CPC and the BoM have indicated a slightly greater than 50% chance of a La Niña event developing over the next 1-3 months (see the Australian BoM ENSO Wrap-Up). |

Larger image of July Zonal Winds 
Larger image of 15 July 2007 Pacific Sea Level Anomalies |
Equatorial Zonal Winds (U-Component Winds) and Sea-Level Topography:
The easterly Trade winds were above normal across most of the equatorial Pacific during July. The observed strengthening of easterly winds along the equatorial zone increased upwelling in the mixed-layer, which is an essential factor in the development of La Niña conditions. Significant week-to-week variability in the near-surface winds has been observed along the equatorial region of the Pacific, as shown in the animation of July zonal winds. Periods of above normal westerly flow occurred across parts of the eastern equatorial Pacific region during early July, as the easterly Trade winds were below-average off the South American coast. Pacific sea levels measured by the NASA/JPL Jason-1 satellite remained below average across the central equatorial Pacific, reflecting the cooling ocean surface temperatures in this region (see the most recent image of 15 July 2007 sea level anomalies). |
 Larger image of July OLR Anomalies Larger image of July OLR Anomalies Larger image of May-July OLR Anomalies Larger image of May-July OLR Anomalies Larger image of July OLR Index Larger image of July OLR Index |
Outgoing Longwave Radiation (OLR):
The map to the left shows the spatial pattern of global OLR (in W m-2) measured by satellite during July. An area of positive OLR anomalies was observed in the eastern Pacific just north of the equator along the Inter-Tropical Convergence Zone (ITCZ). Positive OLR anomalies along the equator in the eastern Pacific were also observed over the past 3 months (May-July) as well. The persistence of positive OLR anomalies due to suppressed tropical convection along the equatorial zone in the central and eastern Pacific is a common signal associated with La Niña conditions. The monthly OLR index for July was +1.1 W m-2 averaged across an area in the western Pacific near the Date Line between 160° E and 160° W. Therefore, the July value of the OLR Index increased significantly, reflecting that a transition from neutral ENSO toward La Niña conditions is possible over the next 1-3 months. Note: high frequency variability in OLR is typically associated with the Madden-Julian Oscillation (MJO), which is an intra-seasonal oscillation in convective activity that propagates west to east in the near-equatorial region from the Indian Ocean into the Pacific Ocean approximately every 30-60 days. The latest MJO activity can be seen in CPC's graphs of Daily MJO Indices. |
 Larger image of July SOI |
Southern Oscillation Index (SOI): The standardized value of the SOI was -0.5 in July. Despite a brief excursion to a positive SOI in June, seven of the previous eight months have had negative SOI values [consistently negative (positive) values of the SOI are typical of El Niño (La Niña) conditions]. Therefore, the SOI has been inconsistent with other atmospheric and oceanic indicators over the past several months, and during July the SOI was indicative of an El Niño-type sea level pressure pattern across the equatorial Pacific basin. |
June
SSTs WARM ACROSS THE CENTRAL EQUATORIAL PACIFIC
Larger image of June SSTs 
Larger image of June Sub-Surface Temperatures 
Larger image of June SST Anomalies 
Larger image of 3-month (April-June) averaged SST Anomalies 
Larger image of 3-month (April-June) TAO Buoy SST Anomalies |
Sea-Surface Temperatures (SSTs) and
Mixed-Layer Conditions:
Equatorial Pacific Ocean surface and subsurface temperatures have been near- or cooler-than-average over the past several months, as the phase of ENSO was neutral. During June, the SSTs warmed across the equatorial Pacific region, as a weak Kelvin wave propagated across the basin. However, water temperatures in the mixed-layer remained below normal, with an area of -2.0°C (-3.6°F) and cooler temperature anomalies between 100-200 meters depth in the central equatorial Pacific. Warmer-than-average upper ocean temperatures remained in the far western equatorial Pacific west of the Date Line in June. For the month, the SST anomaly in the Niño 3.4 Index region was +0.09°C (+0.16°F), which was an increase of +0.46°C (+0.83°F) compared to the May value. The SSTs in the Niño 4 Index region of the western equatorial Pacific also warmed slightly during June, which resulted in a monthly anomaly of 0.19°C (0.34°F) above the mean (map of Niño regions). For the most recent global ocean surface temperatures, please see the loop of satellite-derived weekly SST anomalies for June 2007. The cooling of the SST anomalies in the Niño 3.4 index region over the past several months decreased the 3-month running mean below the long-term average during June. (NOTE: For NOAA's official ENSO classification scheme, please see NOAA's El Niño/La Niña Index Definition). The Climate Prediction Center's most recent ENSO Diagnostic Discussion indicated that the current phase of ENSO was neutral, while the latest ENSO update from the Australian Bureau of Meteorology (BoM) also reflected the ENSO-neutral conditions in the equatorial Pacific basin. Both CPC and the BoM have indicated an elevated probability of a La Niña cold event developing over the next 1-3 months (see the Australian BoM ENSO Wrap-Up). |

Larger image of June Zonal Winds 
Larger image of 18 June 2007 Pacific Sea Level Anomalies |
Equatorial Zonal Winds (U-Component Winds) and Sea-Level Topography:
The easterly Trade winds were above normal across the equatorial Pacific during June. Any observed increase in easterly Trade winds along the equatorial zone increases upwelling in the mixed-layer, and is therefore one important factor that will likely influence the development of a La Niña event in the coming months. Over the past month, significant week-to-week variability in the near-surface winds has been observed along the equatorial region of the Pacific, as shown in the animation of June zonal winds. Periods of anomalous westerly flow occurred across parts of the eastern equatorial Pacific region during June, as the easterly Trade winds were near-average for the month off the South American coast. Pacific sea levels measured by the NASA/JPL Jason-1 satellite remained below average across the central equatorial Pacific, reflecting the cooling ocean surface temperatures in this region (see the most recent image of 18 June 2007 sea level anomalies). |
 Larger image of June OLR Anomalies Larger image of June OLR Anomalies Larger image of April-June OLR Anomalies Larger image of April-June OLR Anomalies Larger image of June OLR Index Larger image of June OLR Index |
Outgoing Longwave Radiation (OLR):
The map to the left shows the spatial pattern of global OLR (in W m-2) measured by satellite during June. A region of positive OLR anomalies was measured in the eastern Pacific just north of the equator along the Inter-Tropical Convergence Zone (ITCZ), illustrating the suppression of tropical convection due to the below-normal SSTs observed in this region. This pattern of positive OLR anomalies along the equator in the eastern Pacific was observed during the April-June period as well. The monthly OLR index for June was +0.6 W m-2 averaged across an area in the western Pacific near the Date Line between 160° E and 160° W. Therefore, the June value of the OLR Index increased significantly, reflecting that a transition from neutral ENSO toward La Niña conditions has likely started. Note: high frequency variability in OLR is typically associated with the Madden-Julian Oscillation (MJO), which is an intra-seasonal oscillation in convective activity that propagates west to east in the near-equatorial region from the Indian Ocean into the Pacific Ocean approximately every 30-60 days. The latest MJO activity can be seen in CPC's graphs of Daily MJO Indices. |
 Larger image of June SOI |
Southern Oscillation Index (SOI): The standardized SOI was +0.2 in June. This shift in sign from a negative to a positive index value followed 6 consecutive months with negative indices [consistently negative (positive) values of the SOI are typical of El Niño (La Niña) conditions]. Note, the monthly SOI values will likely remain positive over the next several months, as NOAA's Climate Prediction Center (CPC) has forecasted the potential development of La Niña (cold event) conditions during July-September 2007. |
May
COOLER SSTs PERSIST IN THE EASTERN EQUATORIAL PACIFIC

Larger image of May SSTs 
Larger image of May Sub-Surface Temperatures 
Larger image of May SST Anomalies 
Larger image of 3-month (Mar-May) averaged SST Anomalies |
Sea-Surface Temperatures (SSTs) and
Mixed-Layer Conditions:
Equatorial Pacific ocean surface and subsurface temperatures have been near- or cooler-than-average over the past several months, as the 2006/2007 El Niño warm event dissipated and the phase of ENSO transitioned to neutral. The cooling has been most pronounced at the surface and in the mixed-layer across the eastern equatorial Pacific. During May, water temperatures in the mixed-layer remained below normal, with an area of -3.0°C (-5.4°F) and cooler temperature anomalies between 50-150 meters depth in the eastern equatorial Pacific. However, warmer than average upper ocean temperatures remained in the far western equatorial Pacific west of the Date Line in May, while in the central tropical Pacific the monthly SSTs were near-normal. For the month, the SST anomaly in the Niño 3.4 Index region was -0.37°C (-0.66°F), which was a change of -0.46°C (-0.83°F) compared to the April value. The SSTs in the Niño 4 Index region of the western equatorial Pacific also cooled slightly during May, which had a monthly anomaly of 0.17°C (0.36°F) above the mean (map of Niño regions). For the most recent global ocean surface temperatures, please see the loop of satellite-derived weekly SST anomalies for May 2007. The cooling of the SST anomalies in the Niño 3.4 index region over the past several months decreased the 3-month running mean below the long-term average for May. (NOTE: For NOAA's official ENSO classification scheme, please see NOAA's El Niño/La Niña Index Definition). The Climate Prediction Center's most recent ENSO Diagnostic Discussion indicated that the current phase of ENSO was neutral, while the latest ENSO update from the Australian Bureau of Meteorology (BoM) also reflected the ENSO-neutral conditions in the equatorial Pacific basin. Both CPC and the BoM have indicated an elevated probability of a La Niña cold event developing over the next 1-3 months (see the Australian BoM ENSO Wrap-Up). |

Larger image of May Zonal Winds 
Larger image of 22 May 2007 Pacific Sea Level Anomalies |
Equatorial Zonal Winds (U-Component Winds) and Sea-Level Topography:
The easterly Trade winds were above normal across the eastern equatorial Pacific during May. In contrast, weaker than normal Trade winds were observed this past month in the western tropical Pacific region. Over the past month, significant week-to-week variability in the near-surface winds has been observed along the equatorial region of the Pacific, as shown in the animation of May zonal winds. Periods of anomalous westerly flow occurred across parts of the equatorial Pacific region during May, as the easterly Trade winds were weaker-than-average across the western equatorial Pacific. Pacific sea levels measured by the NASA/JPL Jason-1 satellite remained below average across the central equatorial Pacific, reflecting the cooling ocean surface temperatures in this region (see the most recent image of 22 May 2007 sea level anomalies). |
 Larger image of May OLR Anomalies Larger image of May OLR Anomalies Larger image of March-May OLR Anomalies Larger image of March-May OLR Anomalies Larger image of May OLR Index Larger image of May OLR Index |
Outgoing Longwave Radiation (OLR):
The map to the left shows the spatial pattern of global OLR (in W m-2) measured by satellite during May. A region of positive OLR anomalies was measured in the eastern Pacific along the equatorial zone, illustrating the supression of tropical convection due to the cold SSTs observed in this region. This pattern of positive OLR anomalies along the equator in the eastern Pacific was observed during the March-May period as well. The monthly OLR index for May was +0.2 W m-2 averaged across an area in the western Pacific near the Date Line between 160° E and 160° W. Therefore, the May value of the OLR Index was very close to zero, reflecting the neutral ENSO conditions. Note: high frequency variability in OLR is typically associated with the Madden-Julian Oscillation (MJO), which is an intra-seasonal oscillation in convective activity that propagates west to east in the near-equatorial region from the Indian Ocean into the Pacific Ocean approximately every 30-60 days. The latest MJO activity can be seen in CPC's graphs of Daily MJO Indices. |
 Larger image of May SOI |
Southern Oscillation Index (SOI): The standardized SOI was -0.4 in May. This was the 3rd consecutive month with an SOI value of -0.4, and the 6th straight month with a negative index value [consistently negative (positive) values of the SOI are typical of El Niño (La Niña) conditions]. However, the overall trend in the monthly SOI values has slowly evolved toward neutral since October, when the SOI fell to -1.7 (the lowest index value of the 2006/2007 El Niño event). Note, the SOI will potentially transition to positive values over the next several months, as NOAA's Climate Prediction Center (CPC) has forecasted the likely development of La Niña (cold event) conditions during June-August 2007. |
April
SSTs REMAIN COOL ACROSS THE EASTERN EQUATORIAL PACIFIC

Larger image of April SSTs 
Larger image of April Sub-Surface Temperatures 
Larger image of April SST Anomalies 
Larger image of 3-month (Feb-Apr) averaged SST Anomalies |
Sea-Surface Temperatures (SSTs) and
Mixed-Layer Conditions:
Ocean surface and subsurface temperatures have been near- or cooler-than-average over the past several months, as the 2006/2007 El Niño warm event dissipated. The cooling has been most pronounced in the mixed-layer across the eastern equatorial Pacific. During April, water temperatures in the mixed-layer remained below normal, with an area of -3.0°C (-5.4°F) and cooler temperature anomalies between 50-150 meters depth in the eastern equatorial Pacific. However, warmer than average upper ocean temperatures remained in the far western equatorial Pacific west of the Date Line in April, as well as in the central tropical Pacific where the monthly SSTs were near-normal. For the month, the SST anomaly in the Niño 3.4 Index region was +0.09°C (+0.16°F), which was a change of +0.20°C (+0.36°F) compared to the monthly anomaly for March. The SSTs in the Niño 4 Index region of the western equatorial Pacific cooled slightly during April, which had a monthly anomaly of +0.34°C (+1.21°F) above the mean (map of Niño regions). For the most recent global ocean surface temperatures, please see the loop of satellite-derived weekly SST anomalies for April 2007. The recent cooling of SST anomalies in the Niño 3.4 index region brought the 3-month running mean below +0.5°C (+0.9°F) in April. (NOTE: For NOAA's official ENSO classification scheme, please see NOAA's El Niño/La Niña Index Definition). The Climate Prediction Center's most recent ENSO Diagnostic Discussion indicated that the phase of ENSO was neutral. The latest ENSO update from the Australian Bureau of Meteorology (BoM) also reflected the transition to neutral ENSO conditions in the equatorial Pacific basin. Both CPC and the BoM have indicated an elevated probability of a La Niña cold event developing over the next several months (see the Australian BoM ENSO Wrap-Up). |

Larger image of April Zonal Winds 
Larger image of 22 April 2007 Pacific Sea Level Anomalies |
Equatorial Zonal Winds (U-Component Winds) and Sea-Level Topography:
The easterly Trade winds were above normal across most of the central and western equatorial Pacific during April. In contrast, weaker than normal Trade winds were observed this past month in the eastern tropical Pacific region. Significant week-to-week variability in the near-surface winds has been observed along the equatorial region of the Pacific over the past month, as shown in the loop of April zonal winds. Periods of anomalous westerly flow occurred in the eastern equatorial Pacific region during April, as easterly Trade winds were below average across the eastern equatorial Pacific. Pacific sea levels measured by the NASA/JPL Jason-1 satellite remained below average across the central equatorial Pacific, reflecting the cooling ocean surface temperatures in this region (see the most recent image of 22 April 2007 sea level anomalies). |
 Larger image of April OLR Anomalies Larger image of April OLR Anomalies Larger image of February-April OLR Anomalies Larger image of February-April OLR Anomalies Larger image of April OLR Index Larger image of April OLR Index |
Outgoing Longwave Radiation (OLR):
The map to the left shows the spatial pattern of global OLR (in W m-2) measured by satellite during April. A region of positive OLR anomalies was measured in the eastern Pacific along the equatorial zone, illustrating the supression of tropical convection due to the cold SSTs observed in this region over the past month. This pattern of positive OLR anomalies along the equator in the eastern Pacific was observed over the February-April period as well. The monthly OLR index for April was +0.1 W m-2 averaged across an area in the western Pacific near the Date Line between 160° E and 160° W. Therefore, the April value was very close to zero, reflecting the neutral ENSO conditions. Note: high frequency variability in OLR is typically associated with the Madden-Julian Oscillation (MJO), which is an intra-seasonal oscillation in convective activity that propagates west to east in the near-equatorial region from the Indian Ocean into the Pacific Ocean approximately every 30-60 days. The latest MJO activity can be seen in CPC's graphs of Daily MJO Indices. |
 Larger image of April SOI |
Southern Oscillation Index (SOI): The standardized SOI was -0.4 in April. The SOI remains negative, a pattern that has persisted over the past 5 months [consistently negative (positive) values of the SOI are typical of El Niño (La Niña) conditions]. However, the monthly indices have been slowly evolving toward neutral since October when it fell to -1.7 (the lowest index value of the 2006/2007 El Niño event). Note, the SOI may transition to positive values over the next several months as NOAA's Climate Prediction Center (CPC) has forecasted a possible development of La Niña (cold event) conditions during May-July 2007. |
March
SSTs REMAIN COOL ACROSS THE EASTERN EQUATORIAL PACIFIC

Larger image of March SSTs 
Larger image of March Sub-Surface Temperatures 
Larger image of March SST Anomalies 
Larger image of 3-month (Jan-Mar) averaged SST Anomalies |
Sea-Surface Temperatures (SSTs) and
Mixed-Layer Conditions:
The above average Sea-Surface Temperature (SST) anomalies associated with the 2006/2007 El Niño diminished in February and March, signaling the end of the warm event. However, warmer than average SSTs persisted in the far western equatorial Pacific west of the Date Line in March. Water temperatures in the equatorial mixed-layer also declined in March, with a large area of -3.0°C (+3.6°F) and cooler temperature anomalies between 50-150 meters depth in the eastern equatorial Pacific. This layer of cooler water persisted and slowly propagated eastward in March. For the month, the SST anomaly in the Niño 3.4 Index region was -0.11°C (-0.20°F), which was a change of -0.17°C (-0.31°F) compared to the February anomaly. The SSTs in the Niño 4 Index region of the western equatorial Pacific warmed during March to a monthly anomaly of +0.67°C (+1.21°F) above the mean (map of Niño regions). For the most recent global ocean surface temperatures, please see the loop of satellite-derived weekly SST anomalies for March 2007. Due to the rapid decrease in the SST anomalies in the Niño 3.4 index region, the 3-month running mean decreased below +0.5°C (+0.9°F) by the end of March. (NOTE: For NOAA's official ENSO classification scheme, please see NOAA's El Niño/La Niña Index Definition). The Climate Prediction Center's most recent ENSO Diagnostic Discussion indicated that the 2006/2007 warm event (El Niño) had dissipated and conditions had transitioned to neutral. The latest ENSO update from the Australian Bureau of Meteorology (BoM) also reflected the transition from a warm event to neutral ENSO conditions in the equatorial Pacific basin (see the Australian BoM ENSO Wrap-Up). |

Larger image of March Zonal Winds 
Larger image of 26 March 2007 Pacific Sea Level Anomalies |
Equatorial Zonal Winds (U-Component Winds) and Sea-Level Topography:
The easterly Trade winds were above normal across the central and eastern equatorial Pacific during March. Significant week-to-week variability in the near-surface winds has been observed along the equatorial region of the Pacific over the past month, as shown in the loop of March zonal winds. A period of anomalous westerly flow occurred in the far western equatorial Pacific region during early March, as easterly Trade winds were stronger-than-average across most of the central and eastern equatorial Pacific basin over the past month. Pacific sea levels measured by the NASA/JPL Jason-1 satellite were below average across the eastern and central equatorial Pacific, reflecting the cooler-than-average ocean surface temperatures that have developed in this region in late February and March (see the most recent image of 26 March 2007 sea level anomalies). |
 Larger image of March OLR Anomalies Larger image of March OLR Anomalies Larger image of January-March OLR Anomalies Larger image of January-March OLR Anomalies Larger image of March OLR Index Larger image of March OLR Index |
Outgoing Longwave Radiation (OLR):
The map to the left shows the spatial pattern of global OLR (in W m-2) measured by satellite during March. A region of negative OLR anomalies was measured in the far western equatorial Pacific near Indonesia, west of the Date Line, illustrating the enhanced tropical convection observed in this region over the past month. The monthly OLR index for March was +0.8 W m-2 averaged across an area in the western Pacific near the Date Line between 160° E and 160° W. Therefore, the March value was positive but near-neutral, reflecting the neutral ENSO conditions. Note: high frequency variability in OLR is typically associated with the Madden-Julian Oscillation (MJO), which is convective activity that propagates west to east in the near-equatorial region from the Indian Ocean into the Pacific Ocean approximately every 30-60 days. The latest MJO activity can be seen in CPC's graphs of Daily MJO Indices. |
 Larger image of March SOI |
Southern Oscillation Index (SOI): The standardized SOI was -0.4 in March. The SOI has shown considerable variability during the recent 2006/2007 El Niño event, although it has shifted toward more neutral values over the first three months of 2007 as the event dissipated and transitioned to a neutral phase [note that consistently negative (positive) values of the SOI are typical of El Niño (La Niña) conditions]. Note, the SOI will likely transition to positive values over the next several months as NOAA's Climate Prediction Center (CPC) has forecasted a possible development of La Niña (cold event) conditions during April-June 2007. |
February
COOLER SSTs DEVELOP ACROSS THE CENTRAL EQUATORIAL PACIFIC

Larger image of February SSTs 
Larger image of February Sub-Surface Temperatures 
Larger image of February SST Anomalies 
Larger image of 3-month (Dec-Feb) averaged SST Anomalies |
Sea-Surface Temperatures (SSTs) and
Mixed-Layer Conditions:
The above average Sea-Surface Temperature (SST) anomalies associated with the 2006/2007 El Niño diminshed over the past month, signaling the end of the warm event. However, warmer than average SSTs persisted in the far western equatorial Pacific from approximately 160°E to 170°W in February. Water temperatures in the equatorial mixed-layer also declined in February, with a large area of -3.0°C (+3.6°F) and cooler temperature anomalies between 50-150 meters depth in the eastern equatorial Pacific. This layer of cooler water continued to develop and slowly propagated eastward in February. For the month, the SST anomaly in the Niño 3.4 Index region was +0.06°C (+0.11°F), which was a decrease of -0.64°C (-1.15°F) compared to the January anomaly. The SSTs in the Niño 4 Index region of the western equatorial Pacific also cooled during February to a monthly anomaly of +0.42°C (+0.76°F) above the mean (map of Niño regions). For the most recent global ocean surface temperatures, please see the loop of satellite-derived weekly SST anomalies for February 2007. Despite the rapid decrease in the SST anomalies in the Niño 3.4 index region, at the end of February the 3-month running mean remained above +0.5°C (+0.9°F). (NOTE: For NOAA's official ENSO classification scheme, please see NOAA's El Niño/La Niña Index Definition). The Climate Prediction Center's most recent ENSO Diagnostic Discussion indicated that the 2006/2007 warm event (El Niño) had dissipated by the end of February. The latest ENSO forecast from the Australian Bureau of Meteorology (BoM) also reflected the transition from a warm event to neutral ENSO conditions in the equatorial Pacific basin over the past month (see the Australian BoM ENSO Wrap-Up). |

Larger image of February Zonal Winds 
Larger image of 27 February 2007 Pacific Sea Level Anomalsies |
Equatorial Zonal Winds (U-Component Winds) and Sea-Level Topography:
The easterly Trade winds were above normal across the central and eastern equatorial Pacific during February. Significant week-to-week variability in the near-surface winds has been observed along the equatorial region of the Pacific over the past month, as shown in the loop of February zonal winds. A period of anomalous westerly flow occurred in the far western equatorial Pacific region during early February, as easterly Trade winds were stronger-than-average across most of the central and eastern equatorial Pacific basin during the past month. Pacific sea levels measured by the NASA/JPL Jason-1 satellite were below average across the central equatorial Pacific in February, reflecting the cooler-than-average ocean surface temperatures that have developed in this region (see the most recent image of 27 February 2007 sea level anomalies). |
 Larger image of February OLR Anomalies Larger image of February OLR Anomalies Larger image of December-February OLR Anomalies Larger image of December-February OLR Anomalies Larger image of February OLR Index Larger image of February OLR Index |
Outgoing Longwave Radiation (OLR):
The map to the left shows the spatial pattern of global OLR (in W m-2) measured by satellite during February. A region of negative OLR anomalies was measured in the far western equatorial Pacific near Indonesia, west of the Date Line, illustrating the enhanced tropical convection observed in this region over the past month. The monthly OLR index for February was +0.1 W m-2 averaged across an area in the western Pacific near the Date Line between 160° E and 160° W. Therefore, the February value was near-neutral, and was also the first month with a positive index value following six consecutive months with negative OLR indices. Note that high frequency variability in OLR is typically associated with the Madden-Julian Oscillation (MJO), which is convective activity that propagates west to east in the near-equatorial region from the Indian Ocean into the Pacific Ocean approximately every 30-60 days). The latest MJO activity can be seen in CPC's graphs of Daily MJO Indices. |
 Larger image of February SOI |
Southern Oscillation Index (SOI): The standardized SOI was -0.5 in February. The SOI has shown considerable variablity during the 2006/2007 El Niño event, although it was negative for the first three months of 2007. Before this, the SOI was negative for six consecutive months during the formative phase of the most recent El Niño [note that consistently negative (positive) values of the SOI are typical of El Niño (La Niña) conditions]. A transition to near-neutral SOI values, and potentially postive monthly values, is possible over the next several months as NOAA's Climate Prediction Center (CPC) has forecasted a transition from neutral to La Niña conditions during April-June 2007. |
January
SSTs COOL ACROSS THE EQUATORIAL PACIFIC

Larger image of January SSTs 
Larger image of January Sub-Surface Temperatures 
Larger image of January SST Anomalies 
Larger image of 3-month (Nov-Jan) averaged SST Anomalies |
Sea-Surface Temperatures (SSTs) and
Mixed-Layer Conditions:
The area of Sea-Surface Temperature (SST) anomalies greater than +1.0°C (+1.8°F) diminshed over the past month, with the warmest anomalies persisting from approximately 120°W to the South American coast in January. Water temperatures in the mixed-layer also decreased in January, with an area of +2.0°C (+3.6°F) and greater temperature anomalies in the top 100 meters of the mixed layer in the eastern equatorial Pacific. In addition, a layer of cooler water below 100 m depth continued to develop and spread further eastward in January. For the month, the SST anomaly in the Niño 3.4 Index region was +0.70°C (+1.26°F) in January, which was a decrease of -0.67°C (-1.21°F) compared to the December anomaly. The SSTs in the Niño 4 Index region of the western equatorial Pacific also cooled during January to a monthly anomaly of 0.77°C (+1.39°F) above the mean (map of Niño regions). For the most recent global ocean surface temperatures, please see the loop of satellite-derived weekly SST anomalies for January 2007. Despite the decrease in the SST anomalies in the Niño 3.4 index region, by the end of January the 3-month running mean remained well-above the +0.5°C (+0.9°F) threshold that indicates the presence of an El Niño episode (NOTE: For NOAA's official ENSO classification scheme, please see NOAA's El Niño/La Niña Index Definition). The Climate Prediction Center's most recent ENSO Diagnostic Discussion indicated that the warm event (El Niño) had reached maturity at the end of 2006 and has shown signs of weakening over the past month. The ENSO forecast from the Australian Bureau of Meteorology (BoM) also reflects the weakening of warm event conditions in the tropical Pacific basin during the first few months of 2007 (see the Australian BoM ENSO Wrap-Up). |

Larger image of January Zonal Winds 
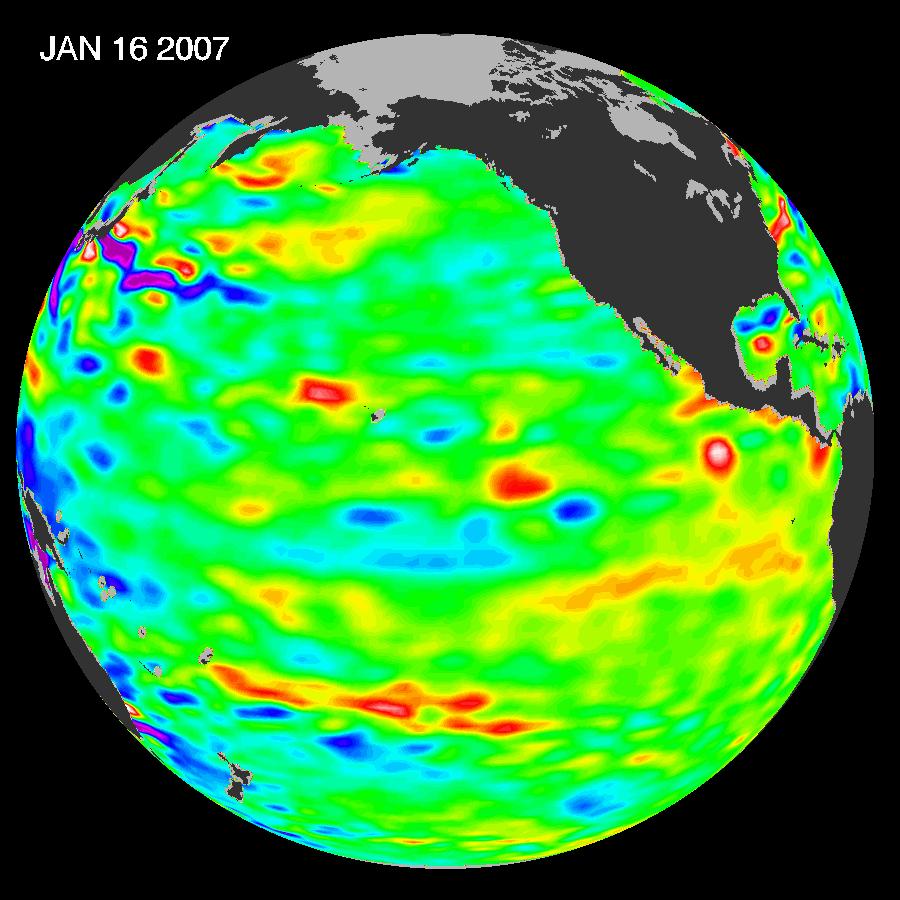
Larger image of 28 January 2007 Pacific Sea Level Anomalsies |
Equatorial Zonal Winds (U-Component Winds) and Sea-Level Topography:
Anomalous westerly winds were observed across the far western equatorial Pacific during January, while the easterly Trade winds were above normal across the central and eastern equatorial Pacific. Significant week-to-week variability in the near-surface winds has been observed along the equatorial region of the Pacific over the past month, as shown in the loop of January zonal winds. A period of anomalous westerly flow occurred in the central and western equatorial Pacific region during mid-January, as easterly Trade winds persisted across the eastern equatorial Pacific basin during the past month. Pacific sea levels measured by the NASA/JPL Jason-1 satellite were above average across the eastern equatorial Pacific in mid-January, reflecting the warmer-than-average ocean temperatures and the mature phase of the El Niño event. However, by the end of January the positive sea level anomalies had dissipated as sea levels were again near average (see the most recent image of 28 January 2007 sea level anomalies). |
 Larger image of January OLR Anomalies Larger image of January OLR Anomalies Larger image of November-January OLR Anomalies Larger image of November-January OLR Anomalies Larger image of January OLR Index Larger image of January OLR Index |
Outgoing Longwave Radiation (OLR):
The map to the left shows the spatial pattern of global OLR (in W m-2) measured by satellite during January. A large region of negative OLR anomalies was observed in the western equatorial Pacific near the Date Line, illustrating the enhanced tropical convection in this region. The monthly OLR index for January was -1.2 W m-2 averaged across an area in the western Pacific between 160° E and 160° W. This was the sixth consecutive month that the OLR index was below the long-term mean. Persistently negative OLR indices are typical of the mature phase of an El Niño episode. As of early February, NOAA's Climate Prediction Center (CPC) has forecasted the current El Niño episode to dissipate during March-May 2007 (click here for CPC's ENSO Diagnostic Advisory Archive. Therefore, it is expected that the monthly OLR Indices will evolve toward zero (near-neutral), as the Walker Circulation shifts to the west and tropical convection in the central equatorial Pacific weakens during the first few months of 2007. Note that high frequency variability in OLR is typically associated with the Madden-Julian Oscillation (MJO, which is convective activity that propagates west to east in the near-equatorial region from the Indian Ocean into the Pacific Ocean approximately every 30-60 days). The latest MJO activity can be seen in CPC's graphs of Daily MJO Indices. |
 Larger image of January SOI |
Southern Oscillation Index (SOI): The standardized SOI was -1.1 in January. The SOI has shown considerable variablity over the past three months with a near-neutral value in November, and a shift to a negative value in December. This recent period of variability followed six consecutive months with negative index values [note that consistently negative (positive) values of the SOI are typical of El Niño (La Niña) conditions]. A transition to neutral SOI values are expected over the next few months, as NOAA's Climate Prediction Center (CPC) has forecasted the current El Niño episode to continue to weaken during March-May 2007. |
ENSO Links
Questions?
| For all climate questions other than questions concerning this report, please contact the National Climatic Data Center's Climate Services Division: |
|
|
For further information on the historical climate perspective presented in this report, contact: |
-or-
|
NCDC / Climate Monitoring / 2007 / ENSO / Help


