skip navigational linksDOL Seal - Link to DOL Home Page
Photos representing the workforce - Digital Imagery© copyright 2001 PhotoDisc, Inc.
www.dol.gov/asp
October 5, 2008    DOL Home > OASP > Chartbook of International Labor Comparisons > Chart 2.9


CHART 2.9

Annual hours worked per employed person, 1996 and 2006

  • In both years, Koreans worked the most hours annually.
  • The Republic of Korea and Ireland experienced the largest reductions in annual hours worked per employed person.

Text only

Chart of Annual hours worked per employed person, 1996 and 2006

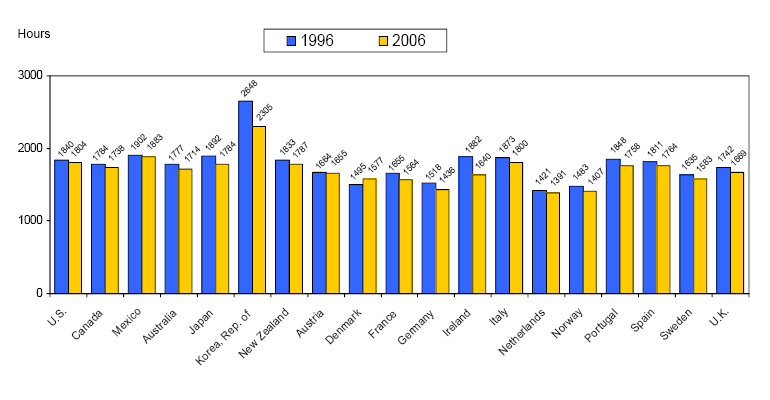
SOURCE: Organization for Economic Cooperation and Development.


Previous Section Next Section


Phone Numbers