
 |
|
 |
![]()

|
|

Age Adjustment
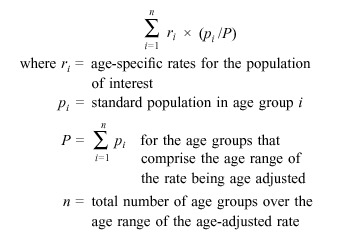
Age adjustment is used to compare risks of two or more populations at one point in time or one population at two or more points in time. Age-adjusted rates are computed by the direct method by applying age-specific rates in a population of interest to a standardized age distribution, in order to eliminate differences in observed rates that result from age differences in population composition. Age-adjusted rates should be viewed as relative indexes rather than actual measures of risk.
Age-adjusted rates are calculated by the direct method as follows:
Age adjustment by the direct method requires use of a standard age distribution. Changing the standard population has implications for racial and ethnic differentials in mortality. For example, the mortality ratio for the black to white populations is reduced from 1.6 using the 1940 standard to 1.4 using the 2000 standard, reflecting the greater weight that the 2000 standard gives to the older population where race differentials in mortality are smaller.
For
more information on implementation of the 2000 population standard for age
adjustment of death rates, see Age Standardization of
Death Rates: Implementation of the Year 2000 Standard. For
more information on the derivation of age adjustment weights for use with
NCHS survey data, see Age Adjustment Using the 2000
Projected U.S. Population. The United States standard
population is available through the
Mortality
Data
Death rates are age
adjusted to the year 2000 U.S. standard
population (Table
I). Prior
to 2003 data, age-adjusted rates were
calculated using standard million proportions
based on rounded population numbers (Table
II).
Starting with 2003 data, unrounded population
numbers are used to age adjust. Adjustment is based on
11 age groups with two exceptions. First, age-adjusted
death rates for black males and black females in 1950
are based on nine age groups, with under 1 year and
1�years of age combined as one group and 75�
years and 85 years of age and over combined as one
group. Second, age-adjusted death rates by educational
attainment for the age group 25� years are based on
four 10-year age groups (25� years, 35� years,
45� years, and 55� years).
Age-adjusted rates for years of potential life lost (YPLL) before age 75 years also use the year 2000 standard population and are based on eight age groups (under 1 year, 1-14 years, 15-24 years, and 10-year age groups through 65-74 years).
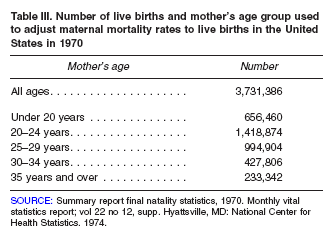
Maternal
mortality rates for pregnancy, childbirth, and the puerperium are
calculated as the number of deaths per 100,000 live births. These rates
are age adjusted to the 1970 distribution of live births by mother's age
in the United States as shown in table III.
National
Health and Nutrition Examination Survey
Estimates based on the National Health Examination Survey and the National
Health and Nutrition Examination Survey are age adjusted
to the year 2000 U.S. standard population using five age groups: 20-34 years,
35-44 years, 45-54 years, 55-64 years, and 65-74 years
or 65 years and over (Table
I).
National
Health
Care Surveys
Estimates based on the National Hospital Discharge Survey, the
National Survey of Ambulatory Surgery, the National Ambulatory
Medical Care Survey, the National Hospital Ambulatory Medical Care
Survey, the National Nursing Home Survey are age
adjusted to the year 2000 U.S. standard population (Table I). Information
on the age groups used in the age adjustment
procedure is contained in the footnotes to the
relevant tables.
National
Health Interview Survey
Estimates based on the National Health Interview Survey (NHIS) are age
adjusted to the year 2000 projected resident population (Table I).
SOURCE: Health, United States
Related
Links
Age
Standardization of Death Rates: Implementation of the Year 2000
Standard. Vol. 47, No. 3. 20 pp. (PHS) 98-1120
View/download
PDF 260 KB
Healthy People 2010: Age Adjustment Using the 2000
Projected U.S. Population. 10 pp. (PHS) 2001-1237
View/download
PDF 118 KB
Rate, Death and Related Rates
Years of Potential Life Lost
|
A
B
C
D
E
F
G
H
I J K L
M N
O P
Q
R S
T U V
W X
Y Z |
This page last reviewed
January 11, 2007
|
