Final 2005
West Nile Virus Activity in the
United States
This
map reflects surveillance findings occurring between
January 1, 2005 through December 31, 2005
as reported to CDC's ArboNET system for public distribution by state and local
health departments.
Click
on the map for a printer friendly version.
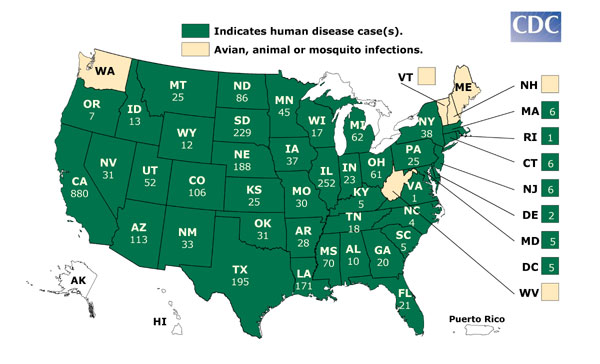
West Nile virus maps reflect surveillance reports released by state and local health departments to CDC's ArboNET system for public distribution. Map shows the distribution of avian, animal, or mosquito infection occurring during 2005 with number of human cases if any, by state. If West Nile virus infection is reported to CDC from any area of a state, that entire state is shaded.
Data table:
Avian, animal or mosquito WNV infections were reported to CDC ArboNET from the following states in 2005: Alabama, Arizona, Arkansas, California, Colorado, Connecticut, Delaware, District of Columbia, Florida, Georgia, Idaho, Illinois, Indiana, Iowa, Kansas, Kentucky, Louisiana, Maine, Maryland, Massachusetts, Michigan, Minnesota, Mississippi, Missouri, Montana, Nebraska, Nevada, New Hampshire, New Jersey, New Mexico, New York, New York City, North Carolina, North Dakota, Ohio, Oklahoma, Oregon, Pennsylvania, Rhode Island, South Carolina, South Dakota, Tennessee, Texas, Utah, Vermont, Virginia, Washington, West Virginia, Wisconsin, and Wyoming.
Human
cases have been reported in: Alabama, Arizona, Arkansas, California, Colorado, Connecticut, Delaware, District of Columbia, Florida, Georgia, Idaho, Illinois, Indiana, Iowa, Kansas, Kentucky, Louisiana, Maryland, Massachusetts, Michigan, Minnesota, Mississippi, Missouri, Montana, Nebraska, Nevada, New Jersey, New Mexico, New York, North Carolina, North Dakota, Ohio, Oklahoma, Oregon, Pennsylvania, Rhode Island, South Carolina, South Dakota, Tennessee, Texas, Utah, Virginia, Wisconsin, and Wyoming.
USGS: http://diseasemaps.usgs.gov/
For information on WNV activity in Canada please see:
http://www.phac-aspc.gc.ca/wnv-vwn/index.html
http://www.cnphi-wnv.ca/healthnet/Welcome.do
WNV
Surveillance Maps detailing human and animal activity additional years:
1999|2000|2001|2002|2003|2004|2005|2006|2007|2008