 |
National Center for Chronic Disease Prevention and Health Promotion
Arthritis
Home | About Us | Contact Us
|
||||||||
National Center for Chronic Disease Prevention and Health Promotion Arthritis Home | About Us | Contact Us |
||||||||
|
|
|||||||||||||||||||||||||||||||||||||||||||||||||||||||||||||||||||||||||||||||||||||||||||||||||||||||||||||||||||||||||||||||||||||||||||||||||||||||||||||||||||||||||
|
|
|
|||||||||||||||||||||||||||||||||||||||
Study reports
National and state direct and indirect costs are presented in the January 12, 2007 MMWR entitled: National and State Medical Expenditures and Lost Earnings Attributable to Arthritis and Other Rheumatic Conditions — United States, 2003.
A detailed report on the national cost study, including the study methods and comparisons of 1997 and 2003 costs, was published in:
Yelin E, Murphy L, Cisternas M, Foreman A, Pasta D, Helmick C. Medical Care Expenditures and Earnings Losses Among Persons with Arthritis and Other Rheumatic Conditions in 2003, and Comparisons to 1997. Arthritis and Rheumatism 2007;56(5):1397-1407.
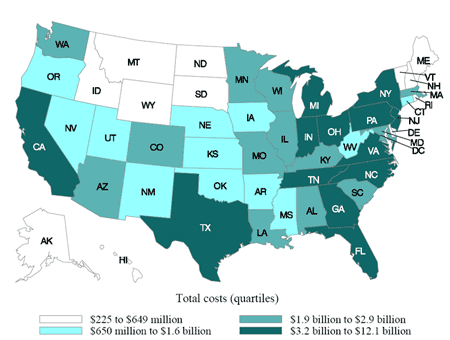
* Total costs = medical expenditures + lost earnings
The table below shows the total costs* (in millions of dollars) attributable to arthritis and other rheumatic conditions for each state in 2003.
Total Costs* (in millions) attributable to Arthritis and Other Rheumatic Conditions, By State, United States, 2003 |
|||||||
| $225 million to $574 million
|
$650 million to $1.6 billion
|
$1.9 billion to $2.9 billion
|
$3.2 billion to $12.1 billion
|
||||
|---|---|---|---|---|---|---|---|
| District of Columbia | 226 | Nebraska | 757 | Colorado | 1,920 | Indiana | 3,181 |
| Wyoming | 243 | New Mexico | 770 | Louisiana | 2,036 | Tennessee | 3,271 |
| Alaska | 275 | Utah | 820 | South Carolina | 2,133 | Virginia | 3,466 |
| North Dakota | 285 | Nevada | 1,022 | Minnesota | 2,172 | New Jersey | 3,544 |
| Vermont | 290 | Kansas | 1,106 | Arizona | 2,343 | Georgia | 3,911 |
| South Dakota | 351 | West Virginia | 1,188 | Kentucky | 2,426 | North Carolina | 4,112 |
| Delaware | 363 | Iowa | 1,250 | Wisconsin | 2,445 | Michigan | 5,557 |
| Hawaii | 375 | Arkansas | 1,441 | Maryland | 2,479 | Ohio | 5,745 |
| Montana | 396 | Connecticut | 1,443 | Alabama | 2,597 | Pennsylvania | 6,578 |
| Rhode Island | 511 | Mississippi | 1,495 | Illinois | 2,670 | Florida | 7,624 |
| Idaho | 564 | Oregon | 1,609 | Massachusetts | 2,734 | Texas | 8,706 |
| New Hampshire | 574 | Oklahoma | 1,628 | Washington | 2,787 | New York | 8,726 |
| Maine | 648 | Missouri | 2,874 | California | 12,137 | ||
* Total costs = medical expenditures + lost earnings
![]() Some documents on this page are available in Portable Document Format (PDF). Learn more
about viewing and printing PDF documents with
Acrobat Reader.
Some documents on this page are available in Portable Document Format (PDF). Learn more
about viewing and printing PDF documents with
Acrobat Reader.
Page last reviewed: June 15, 2007
Page last modified: June 13, 2007
Content Source: Division of
Adult and Community Health,
National Center for Chronic Disease Prevention and Health Promotion
|
Privacy
Policy | Accessibility United
States Department of Health and Human Services |