|
|
|
|
www.dol.gov
|
| October 19, 2008 DOL Home > About DOL > Annual Report 2004 > Strategic Goal 1 |
|
DOL Annual Report, Fiscal Year 2004 Strategic Goal 1: A Prepared Workforce Enhance Opportunities for America's Workforce A strong national economy depends, in part, on preparing workers to be qualified job candidates possessing skills that are relevant to the needs of today's employers. In addressing this challenge, the Department must work with a wide spectrum of job seekers, including those with special needs such as the disadvantaged, people with disabilities, veterans, disadvantaged youth, and those who have lost their jobs due to foreign competition. Addressing the job seekers' needs is further complicated by the dynamics of the changing workplace. New technologies, increased competition, and changing labor markets have prompted employers to downsize, change employment patterns, and seek alternative labor sources such as qualified foreign workers. While employers and workers bear ultimate responsibility for adapting to these challenges, the Department has a leadership responsibility to support the needs of the changing workforce and position the U.S. for continued economic development and growth. This aspect of our mission is captured by the first strategic goal — A Prepared Workforce. Agencies with programs supporting this goal are the Employment and Training Administration (ETA), Veterans' Employment and Training Service (VETS), the Bureau of Labor Statistics (BLS), and the Office of Disability Employment Policy (ODEP). The Department's performance in achieving this goal is determined by accomplishments organized at the outcome goal level and measured at the performance goal level. Three broad objectives — Outcome Goals 1.1, 1.2 and 1.3 — support Strategic Goal 1, and they contain twelve performance goals (see table below). In FY 2004, the Department made further progress in positively impacting employment outcomes for Americans — despite the challenge of a persistently sluggish economy and its disproportionate effect on DOL target populations. Although just half of the performance goals were achieved, most targets were reached and all programs documented improved results.
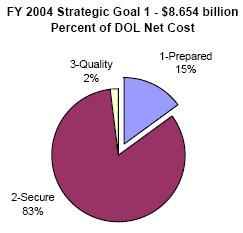
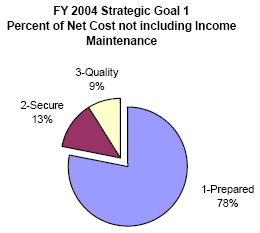
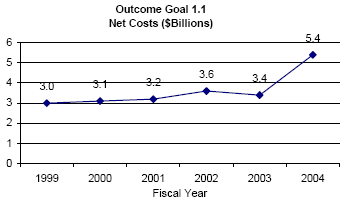
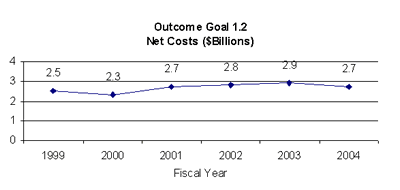
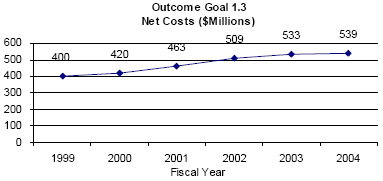
The following charts illustrate DOL's strategic goal net costs in FY 2004, with A Prepared Workforce shares set apart. The first allocates total Departmental costs of $56.676 billion; the second allocates an adjusted net cost of $11.102 billion that excludes major non-discretionary items associated with Strategic Goal 2.7 Net costs of this goal in FY 2003 were $6.923 billion. The increase occurred in large part because of relocation of the WIA Dislocated Worker and TAA programs to this goal from Goal 2; together, these two programs cost approximately $2 billion annually.
The outcome goals and programs listed above, along with their results, costs, and future challenges are discussed in more detail on the following pages. 7The excluded costs are referred to as Income Maintenance — unemployment benefit payments to individuals who are laid off or out of work and seeking employment ($41.424 billion) plus disability benefit payments to individuals who suffered injury or illness on the job ($4.150 billion). Outcome Goal 1.1 — Increase Employment, Earnings, and Assistance America's engine of prosperity is its skilled workforce. The Department assists workers and employers with valuable information and specific training to help them take full advantage of the constantly changing demands and resources in the labor market. Central to this effort is a nationwide network of approximately 2,000 DOL-funded One-Stop Career Centers which assist communities to match adults to work and skill enhancement opportunities. This comprehensive workforce development system also helps businesses meet their ongoing recruitment and human services needs. For those with disabilities, the One-Stop Centers have improved access to their facilities and services by installing assistive technologies. DOL is also making a special effort to help our nation's military service members adjust to and re-enter the civilian workforce, largely by providing priority services at all One-Stop Centers pursuant to the Jobs for Veterans Act of 2002. The Employment and Training Administration (ETA) and the Veterans' Employment and Training Service (VETS), with support from the Women's Bureau, the Office of Faith-Based and Community Initiatives and the Office of Disability Employment Policy (ODEP), operate a number of programs that provide the information, assistance, and skill-building opportunities that lead to increased employment and earnings. In the first column of the table below appear the numbers, agencies, reporting periods8, goal statements, and achievement for DOL performance goals associated with this outcome goal. The second column presents a summary of targets reached, substantially reached, and not reached for the indicators associated with each performance goal and the most significant result(s) for this past year.
8Those applying to a Program Year (PY) are
reporting on the period from July 1, 2003 to June 30, 2004 due to the
forward funding mechanism of the Workforce Investment Act (WIA) of 1998. Net Cost of Programs The $2 billion increase in costs for Outcome Goal 1.1 resulted almost entirely from moving the Dislocated Worker Program and Trade Adjustment Act performance goals from Strategic Goal 2 (Outcome Goal 2.3 in the DOL FY 2003 Performance and Accountability Report) and into Outcome Goal 1.1 in Strategic Goal 1. Therefore, these costs do not represent an increase in DOL costs but a shift of costs from one strategic goal to another.
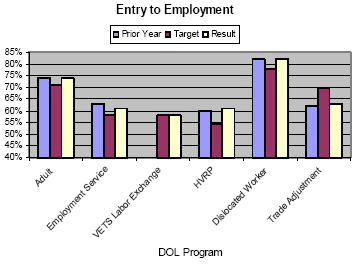
Results Summary Performance for most DOL's employment and training programs is measured by entered employment — the percentage of participants who obtain jobs subsequent to receipt of services — and by retention — the percentage of those who obtained jobs who are still employed six months later. Earnings are another important indicator but until very recently, such data were not collected by all grantees, nor were the measures uniform. The charts below plot, for each program that tracks employment and retention rates, the result for the previous year (if available), the target for the reporting period and its actual (or estimated) result. There are significant differences in entry and retention rates between programs; this can be explained by the types of services offered and the populations they serve. But year-on-year entry rates did not change significantly; in fact, they were unchanged for three of the five programs with data, increased slightly for one and declined slightly for another. This lack of progress was not entirely surprising; given the slow economic recovery, several targets were below prior year actual levels. The trend in retention rates is more positive. For the three programs with prior year data, one held steady, another increased slightly and a third went up by several percentage points. This, too, is consistent with what we know about the economic environment. Workers tend to hold on to positions when growth is less robust. Strategies that made positive contributions were: enhanced use of technology to provide universal access and target job search and training; further integration of the workforce development system via co-enrollment; expanded outreach to businesses (especially in high growth industries); and increased use of competitive grant processes. Future Challenges Management challenges include fully implementing the Jobs for Veterans Act of 2002, which calls for consideration and accommodation in integrating services for veterans at the State and local levels. An older challenge is data availability and timeliness, which received attention by the Government Accountability Office (GAO) in its June 2004 report States and Local Areas Have Developed Strategies to Assess Performance, but Labor Could Do More to Help (see Study 9 in Appendix 2). Similarly, the Department's Office of Inspector General has questioned whether data reported by States for WIA performance were accurate and supportable. In response, DOL developed a data validation methodology, and provided handbooks, user guides, and software for all State workforce agencies. States were required to validate their PY 2003 WIA performance data reports using this methodology. The Trade Adjustment Assistance (TAA) program has struggled with performance issues for several years, but is taking remedial action. In response to recommendations from the Program Assessment Rating Tool (PART) reviews in recent years, new agreements between the Secretary of Labor and the States' Governors will include performance expectations to encourage better results. Additionally, TAA will adopt the common measures for Federal employment and job training programs, with implementation complete by late FY 2005 or early FY 2006. Use of common measures will align Trade Act program measures with those for the WIA Dislocated Worker program and promote the goals of co-enrollment and coordination between the two programs. Also, DOL is conducting a five-year impact evaluation of the TAA program (final report in FY 2010). Recommendations will be used to improve performance, to assess implementation of the Trade Reform Act and to inform the TAA reauthorization process. Increase Employment, Retention, and Earnings for Qualified Adults Increase the employment, retention, and earnings of individuals registered under the Workforce Investment Act Adult program.
Indicators 82 percent of those employed in the first quarter after program exit will be employed in the third quarter after program exit; and The average earnings change will be $3,100 for those who are employed in the first quarter after program exit and are still employed in the third quarter after program exit. Program Perspective National labor market conditions strongly influence the WIA Adult program outcomes. In periods of economic expansion, as experienced in the late 1990s, outcomes met or exceeded targets. In recent years, as the economy began to recover from the recession of 2001, further improvement in employment and retention rates and earnings change has been more difficult. Despite this challenge, DOL continued to improve its integrated one-stop delivery system, thereby allowing the program to raise standards for performance beyond FY 2000 baselines. Over the past four years, targets for entered employment and retention increased a total of six and seven percentage points, respectively. The earnings change target has been adjusted to more accurately reflect the current economic operating context. Results, Analysis and Future Plans
The entered employment rate of 74 percent and the employment retention rate of 85 percent exceeded the targets by three percentage points, respectively. The earnings change of $3,260 exceeded the target by $160. As illustrated in the charts, conditions are generally 80% improving. The entered employment and retention outcomes have remained above the targets, while the outcomes for earnings increase rose significantly from $2,900 in PY 2002 to $3,260 in PY 2003. The demand for goods and services over the past year, as indicated by the major economic indicators, has a positive effect on the people served by the Adult program. The drop in the unemployment rate from 6.3 percent last year (CY 2003) to 5.6 percent gave a boost to the program outcome and partially accounts for the gains in earnings above the target. To continuously improve the outcomes of WIA Program Year participants, the Department is producing new tools, creating incentives, and simplifying the coordinating process. Key strategies include:

Strengthening business relationships to assure demand-driven services and to better identify and fill jobs in growth occupations. The intent is to focus the workforce investment system on the President's High Growth Job Training Initiative. The purpose of which is to serve America's growing industries and to match workers with jobs in demand. Assuring universal access to the workforce Program Year investment system with emphasis on targeted outreach. DOL continues to provide incentives for state and local program operators to increase the number of qualified referrals to growth occupations from traditionally underutilized labor pools. Leveraging WIA resources to increase total resources available to prepare the workforce. DOL will work with other Federal agencies to set optimum conditions allowing for co-enrollment in programs without creating negative consequences for performance levels. Management Issues One lesson from the first four years of WIA is that separate funding streams for services can have a negative impact on program performance because of the duplication of the services and additional money spent on administrative support. The Department proposes to address this barrier by consolidating these funding streams when WIA is reauthorized. The Government Accountability Office (GAO) released a report on WIA in June 2004: States and Local Areas Have Developed Strategies to Assess Performance, but Labor Could Do More to Help (Study 9 in Appendix 2). The report examined data availability and timeliness issues. ETA also contracted with an independent research team to conduct an evaluation of the Workforce Investment Act of 1998. The study, The Workforce Investment Act in Eight States: State Case Studies from a Field Network Evaluation (Study 21 in Appendix 2), examined national goals and the roles of Federal, State, and local partners in implementing the law in eight states. Another independent study, Creating Partnerships for Workforce Investment: How Services are Provided Under WIA (Study 20 in Appendix 2), presents findings from case studies of sixteen local boards across eight states that may help other local boards in developing local systems. Improve Employment for Public Labor Exchange Users Improve the outcomes for job seekers and employers who receive public labor exchange services. Indicators 72 percent of job seekers will continue to be employed two quarters after initial entry to employment with a new employer; The number of job openings listed with the public labor exchange (with State workforce agencies and America's Job Bank (AJB) will increase 1% over PY 2002, as adjusted for economic fluctuation. PY 2002 result was 10.2 million (6.1 million listed with State workforce agencies and 4.1 million listed with AJB); The number of job searches conducted by job seekers from America's Job Bank will be collected to determine a baseline for setting future performance targets; and The number of resume searches conducted by employers from America's Job Bank will be collected to determine a baseline for setting future performance targets. Program Perspective The public labor exchange system's effectiveness is measured by the success of job seeker customers in finding and retaining employment. The performance of the public labor exchange is largely a function of the labor market — the number and quality of jobs and workers available. For example, during Program Year 2003 (July 2003 to June 2004), the nation's unemployment rate dropped from 6.2 percent to 5.6 percent. In this period, ETA saw an increase in the number of job openings posted with State workforce agencies and America's Job Bank, in particular in the information, professional and transportation industries. Second, ETA encouraged States to register job seekers that receive automated, self-directed and/or staff-assisted services. Job seekers using self-service tools have been shown to have a positive impact on the entered employment rate, since they are generally more job ready than other (traditional) customers of the public labor exchange.
Results, Analysis and Future Plans
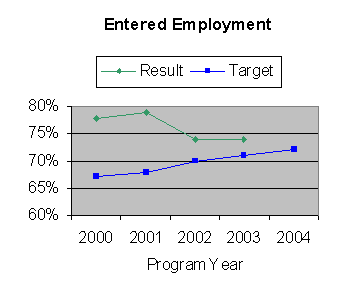
The reports submitted by the States for the quarter ending June 30, 2004 served as the first set of reports reflecting a complete program year (PY 2002) of entered employment outcome data on job seekers registered with the public labor exchange. These reports also contained two quarters of employment retention data on a subset of PY 2002 labor exchange registrants for whom retention outcomes using wage record matches are available. The number of job openings in PY 2003 represents a roughly 22.5 percent increase over the PY 2002 level. The entered employment rate and the retention rate together function as true indicators of the labor exchange's success. The entered employment rate points to the ability of the workforce system to meet the employment needs of workers, the majority of whom are unemployed, in an efficient and cost effective manner. The retention rate outcome shows registrants are being placed in jobs that match employers' needs and the individuals' interests. Among strategies to continually improve performance, DOL has aggressively expanded outreach efforts to employers through the Business Relations Group (BRG) which has worked to partner high-growth industries to list jobs with the one-stop delivery system. This dialogue is helping to match willing jobseekers with willing employers. In PY 2004, the Employment Service will actively participate in DOL efforts to research statistical models for goal setting purposes and implement a pilot with the Veterans Employment and Training Service to move toward an earnings gain measure for the public labor exchange.
Management Issues The primary management issue facing the Employment Service is accomplishing closer integration of the program with the Workforce Investment Act (WIA) Adult and Dislocated Worker programs, either through reauthorizing the WIA and possibly consolidating all adult services into a single funding stream or through policy guidance and administrative and/or regulatory action. The implementation of the common measures initiative and its associated single data collection and reporting system to capture outcomes will also be a major activity for the Employment Service over the coming year.
Satisfy High Growth Industry Labor Needs via Apprenticeships Strengthen the registered apprenticeship system to meet the training needs of business and workers in the 21st Century. Indicators Increase the number of new apprentices registered by OATELS staff over the established baseline from 67,401 to 68,592. Program Perspective The President's High Growth Job Training Initiative (HGJTI) identified the following as growth industries: aerospace; automotive; biotechnology; energy; geospatial; health care; high-technology manufacturing; hospitality; information technology; retail trade; and transportation. DOL seeks to strengthen the National Registered Apprenticeship System to provide more opportunities for workers to find jobs requiring recognized credentials. It allows employees to get the skilled workers that they need to stay competitive and keep the economy growing. Results, Analysis and Future Plans OATELS has promoted, marketed, and provided technical assistance to new and existing sponsors to develop, register, and maintain apprenticeship programs and apprentices, and provided technical assistance to SAC staff. Consultative sales techniques have been instrumental in the program's success. Since the initial Consultative/Solutions Sales Techniques training began in June 2003, the number of programs and apprentices in new and emerging High Growth Jobs Training Initiative (HGJTI) industries has grown significantly. Activities in HGJTI are thriving throughout the country. Employers in new and emerging industries are becoming increasingly interested in using the apprenticeship concept to develop professional workers. DOL mounted several pilot programs to improve OATELS. President Bush showcased the National Information Technology Apprenticeship System project at a community college in Arizona. This pilot is designed to improve the productivity of American information technology (IT) workers, lower the cost of hiring and training for American employers and provide a structured approach to IT career development throughout the national workforce investment system. Another pilot, the National Institute for Metalworking Skills (NIMS), has designed the National Competency Based Apprenticeship System. This new system of training and credentialing fundamentally changes and dramatically improves the way that skilled workers are trained in the American metalworking industry. Key to the new system is the integration of standards-based credentialing assessments linked with relevant on-the-job-training. This provides maximum flexibility for apprentices and employers alike, increases precision and productivity through the introduction of technology as part of the skill standards, and opens career ladders through the metalworking industry. Management Issues Expansion of new Registered Apprenticeship programs is dependent upon economic conditions. If certain industries are downsizing their workforce, they are less likely to institute new Registered Apprentice programs. Conversely, as success in the new and emerging high growth jobs and industries demonstrates, there are opportunities to expand the Apprenticeship programs. FY 2005 will be a transitional year for evaluating performance in the Apprenticeship program. This will be the first year that the program will be using measures of employment, retention, wage gain, and efficiency. However, due to data limitations, the program will not be able to calculate outcomes based on the Common Measures methodology. Rather, the program will have proxy measures that resemble the Common Measures. This first step will allow the program to collect valuable data that will help inform the establishment of baselines. Actions to resolve data issues will continue to be pursued in FY 2006 to enable ETA to use the Common Measures for the Apprenticeship program.
Increase Employment for Persons with Disabilities Provide national leadership to increase access and employment opportunities for youth and adults with disabilities receiving employment, training, and employment support services by developing testing, and disseminating effective practices. Indicators Increase by 5% the entered employment rate at pilot sites. Increase by 10% the 3-month and 6-month retention rates for people with disabilities served by the pilots; and Increase by 10% effective practices identified through pilot projects and other research-related initiatives. Program Perspective According to the U.S. Census Bureau, among the non-institutionalized population aged 16-64 in the United States, 33 million people have disabilities. Of this group, 18.6 million people with disabilities, or 56 percent, are employed. According to the Department of Labor's Bureau of Labor Statistics (BLS), projections for employment between 2002 and 2012 show an increase of 21.3 million jobs, about 600,000 more jobs than were added in the previous decade. This presents a unique opportunity to promote disability employment policies and practices that will most effectively reach into the untapped pool of people with disabilities.
Results, Analysis and Future Plans In FY 2004, a total of more than 6,000 people were served through the various pilot projects administered by ODEP. More than 900 participants (19.2 percent) entered employment through the pilot sites. Retention baselines were established at 12.3 percent at three months and 6.9 percent at six months. The baseline for effective practices is ten. Based on results of rigorous evaluations and periodic employment outcome analysis, ODEP will continue to refine, modify and adjust the figures for these indicators In FY 2005 the Department will continue evaluating workforce development system practices through pilot and research projects and programs. These activities develop effective practices and policies for dissemination to the workforce development system and partners providing employment, training, and employment support services to adults and youth with disabilities.
Management Issues ODEP's multi-year external evaluation of pilot projects assess the nature and extent of systems change to determine the effectiveness of strategies employed for expanding and strengthening the capacity of the workforce development system to respond to the needs of people with disabilities. Findings thus far include: (1) the capacity of the workforce development system has expanded and is strengthened to better serve people with disabilities; (2) people with disabilities are moving from low-skill, minimum wage work to higher-paid jobs in technical or other new career fields; (3) attitudes at One-Stop Centers regarding the provision of services to people with disabilities are changing; and (4) governmental agencies are now working together to share information and leverage resources to better serve people with disabilities. ODEP's multi-year case study examines strategies implemented to serve the employment needs of persons with disabilities and the supports needed to provide efficient and universal access to the services of the workforce development system at 12 WIA-assisted locations (six adult and six youth). Findings thus far include the needs: (1) to enhance physical accessibility to service centers; (2) to increase staff familiarity with assistive technology; (3) to integrate mandated and non-mandated disability partners into the overall services of the One-Stop Centers such as Vocational Rehabilitation; (4) to train and educate staff to work with individuals with a disability; (5) to centralize data banks and standardize data collection techniques; and (6) for cross-agency training. Help Veterans Get and Keep Jobs Increase the employment and retention rate of veteran job seekers registering for public labor exchange services Indicators 72% of veteran job seekers will continue to be employed two quarters after initial entry into employment with a new employer. Program Perspective VETS currently measures entry to employment and retention in employment as fundamental outcomes of public labor exchange services. Because results through June 30, 2004 represent the first year's outcomes under a new reporting system, comparable historical results are not available. A key strength of the new reporting system is that it links delivery of services with the earnings of the veterans served, as documented in Unemployment Insurance (UI) wage records.
Results, Analysis and Future Plans The reports submitted for the quarter ending June 30, 2004 provide the first entered employment outcomes for veteran job seekers reported over a full Program Year (PY), based upon the new UI wage record reporting system. These reports also provide the first employment retention outcomes for veterans using the UI reporting system, including data from the first two quarters of PY 2003. These first outcomes represent the fulfillment of a long-term process of development, initial implementation, and transition of the new reporting system. During that same time period, in partnership with ETA, VETS has been developing and implementing new performance measures. VETS conducted pilot data collection initiatives applying the new reporting procedures to Program Years 1999, 2000, and 2001 in order to establish baseline measures under the new system. For PY 2002-2003 VETS field staff and staff affiliated with State Workforce Agencies in every State negotiated performance measures for veterans served by the public labor exchange. Extensive coordination with program stakeholders likely played a key role in the success of the public labor exchange in reaching this first set of targeted outcomes for veterans under the new reporting and measurement conditions. Entry to employment for veterans served by the public labor exchange was applied as an indicator under the prior system of measurement and reporting. However, PY 2003 marked the first time retention in employment was applied. The successful outcomes attained during this first year of experience with this target provide a basis for VETS to adjust future performance targets. For PY 2004, an Entered Employment Rate target for disabled veterans has been added. In addition to these enhancements to VETS' performance measurement systems, which are scheduled for implementation during PY 2004 and PY 2005, VETS and ETA will collaborate to establish baseline values for measures of Earnings Gain and Efficiency, in accord with the Common Measures. 10This goal appeared in the DOL FY 2003 Annual Performance Plan as a fiscal year goal. Due to the data system transition described in this narrative, it was converted to a Program Year 2003 goal. Accordingly, results presented are for the period July 1, 2003 to June 30, 2004.
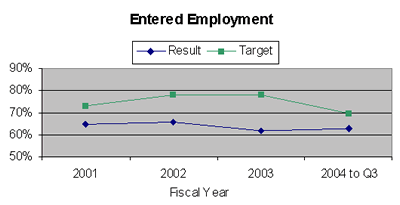
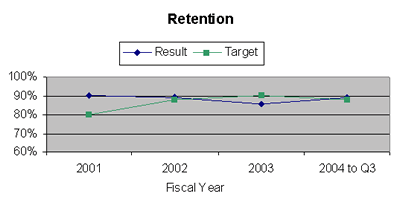
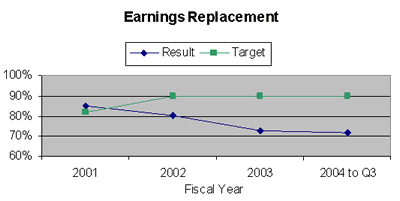
Management Issues Early in FY 2004, Battelle Memorial Institute completed a long-term policy research project examining the needs of unemployed veterans, and the extent to which those needs are met by the public labor exchange (Study 25 in Appendix 2). The study indicated that traditional labor exchange services, such as job search and referral, were associated with the most favorable outcomes for young, recently separated veterans. Case management, which is an intensive service typically provided by VETS funded staff, was associated with the most favorable outcomes for older, recently separated veterans. An implication of these results is that further exploration is called for to identify a service delivery approach that would improve outcomes for veterans who are not recently separated. With the advent of UI wage record based reporting, lag time in reporting outcomes has become a major concern. A study conducted during FY 2004 by Bradson Corporation identified two potential supplementary measurement strategies (Study 26 in Appendix 2). The first involves an application of unemployment data to identify those States in which veteran unemployment is high relative to non-veteran unemployment. The second calls for enlisting selected States to apply Report of Hires data to provide an early indication of expected outcomes based on subsequent application of UI wage records. VETS is confirming the technical feasibility of the first strategy, and the operational feasibility of the second strategy. The Jobs for Veterans Act, passed late in 2002, established a new statutory requirement that veterans be accorded priority of service in all Department of Labor training programs. The impact of this new provision falls primarily upon workforce development programs funded by ETA. In response to the new mandate, DOL funded a study, conducted by the Urban Institute, to identify strategies that could be applied to implement this requirement (Study 27 in Appendix 2). The study examined procedures applied in One-Stop Career Centers, as well as options offered by electronic resources, and recommended a) establishment of performance goals for priority of service; b) refinements in office operations; and c) enhancements to electronic resources. An urgent financial management issue involving the DVOP/LVER grants — VETS' contribution to the public labor exchange — has arisen in connection with recent legislative changes that expanded permissible expenses. Open questions include expense categories to be applied to direct and indirect charges and the acceptable ratio of indirect to direct charges. VETS has launched an initiative to resolve this issue in consultation with representatives of the SWAs. Homeless Veterans Are Assisted to Obtain Employment Veterans enrolled in Homeless Veterans' Reintegration Program (HVRP) enter employment Indicator Program Perspective Entry to employment has been emphasized as the most appropriate outcome indicator, and for the last two years, the entry rate has averaged at or above 60 percent. Recently, however, VETS has communicated clearly to all HVRP grantees that retention in employment is the most significant outcome indicator. We intend to continue this emphasis on retention for the foreseeable future, since stabilizing the earning capacity is a prerequisite to stabilizing the living situation of homeless veterans. Results, Analysis and Future Plans The high rate of success achieved by HVRP grantees in serving this subset of the veteran population, which typically is characterized as having multiple barriers to employment, is attributable, in part, to the program design established by VETS. That design calls for a network of community-based organizations, including faith-based grantees, which focus their limited fiscal resources on the delivery of customized employment services. These grantees are to achieve integration of the required services by closely coordinating their efforts with other local providers in order to provide participants with a full range of specialized services. HVRP grants are awarded on a competitive basis and are limited to a three-year performance period. Award of annual funding increments for the second and third (option) years within the three-year cycle is based upon satisfactory achievement of the performance goals set forth in the grant application. The combination of limited grant duration and ongoing competitive awards lead to greater effectiveness. For PY 2004, we will measure retention in employment, with a target of 55 percent of HVRP participants maintaining employment six months following entry to employment. To maintain the entry to employment rate accomplishments while improving employment retention rates, VETS will continue to provide guidance to the HVRP grantee network, sharing best practice experiences. 11This goal appeared in the DOL FY 2003 Annual Performance Plan as a fiscal year goal. Later, it was converted to a Program Year 2003 goal to fund and measure HVRP grantee performance on a schedule consistent with other DOL employment and training programs. Accordingly, results presented are for the period July 1, 2003 to June 30, 2004. Management Issues The distribution of management responsibility for this program is consistent with the need expressed by grantee staff and GOTRs. VETS plays a lead role regarding the Special Provisions; the DOL procurement unit plays a lead role regarding the General Provisions; and the Department of Health and Human Services (HHS) plays a lead role regarding financial operations (because of the program's reliance upon the Payment Management System administered by HHS. To improve the integration of the requirements and procedures in this shared management arrangement, VETS intends to apply contractor support during FY 2005 to prepare two management manuals. One version of the manual will be oriented to grantee staff and the other version will be oriented to VETS staff serving as GOTRs. In addition to improving integration, it is hoped that this initiative also will promote improved consistency in program operations and closer headquarters-field coordination. Assist Dislocated Workers Increase the employment, retention, and earnings replacement of individuals registered under the Workforce Investment Act Dislocated Worker Program. Indicators 88 percent of those employed in the first quarter after program exit will be employed in the third quarter after program exit; and Those who are employed in the first quarter after program exit and are still employed in the third quarter after program exit will have 93 percent of their pre-dislocation earnings. Program Perspective Three key indicators are used to assess the program's success. The entered employment rate indicates how quickly participants' incomes (hence family security) are restored and whether they maintain continuous attachment to the labor force with minimal disruption. Retention rate and earnings replacement indicators demonstrate the program's effectiveness at matching and/or enhancing participants' skills and abilities to maximize their opportunities. Labor market conditions have a major influence on the Dislocated Worker program outcomes. During the last few years beginning with the recession of 2001, improving performance has proven more difficult than in times of economic boom. Despite external economic forces, DOL has consistently looked for ways to increase targets while improving program management. 12This goal appeared in the Department's FY 2003 Annual Performance Plan as Performance Goal 2.3A. It has been renamed to be consistent with the FY 2004 plan, which moved this program to Outcome Goal 1.1. Results, Analysis and Future Plans
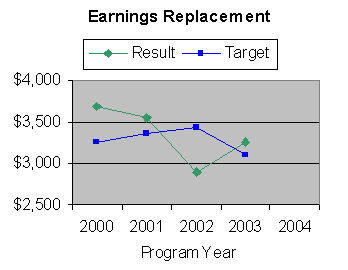
Although the indicators for entered employment rate and retention rate exceeded performance targets by four and two percentage points, respectively, the earnings replacement rate was two percentage points below the target. Even with successes in employment and retention, the continuing decrease in post-dislocation earnings measure may reflect the broader economic conditions. First, employers have a more qualified worker pool from which to select, as there has been an increase in the number of Americans obtaining high school diplomas Program Year and bachelor's degrees over the past year. Second, there was an increase in the supply of labor relative to the demand, putting downward pressure on wages. Third, displaced workers who experience lengthy periods of unemployment typically become increasingly willing to take jobs paying less than their previous jobs. In sum, while employment and retention rates remain fairly steady as dislocated workers more readily accept lower-paying jobs and stay with them until periods of growth, their post-dislocation earnings have continued to decline. During Program Year 2003, DOL held six regional forums focused on providing an integrated service system for dislocated workers. This is part of the Department's effort to improve the alignment of federal and state processes and response times, and to maximize funding allocations to reach more customers and enhance program results. To continuously improve the outcomes of dislocated workers, the Department is producing new tools, creating incentives, and simplifying the coordinating process. Key strategies include: 1) Strengthening business relationships to assure demand-driven services and to better identify and fill jobs in growth occupations; 2) Assuring universal access to the workforce investment system with emphasis on targeted outreach; and 3) Using non-WIA resources wherever possible, thereby leveraging WIA resources committed to core functions necessary to prepare the workforce. With implementation of the common measures for employment and training programs and with reauthorized WIA, the workforce investment system can better integrate the Adult and Dislocated Worker formula programs and the labor exchange functions under the Wagner-Peyser Act. Combined with enhanced use of technology that will inform adult customers about the labor market, job opportunities, and services, this integrated workforce system will increase efficiencies and performance.
Management Issues One lesson from the first four years of WIA is that separate funding streams for services can have a negative impact on program performance because of duplication of services and redundant administrative cost. The Department proposes to address this barrier by consolidating these funding streams when WIA is reauthorized. The Government Accountability Office (GAO) released a report on WIA in June 2004: States and Local Areas Have Developed Strategies to Assess Performance, but Labor Could Do More to Help (Study 9 in Appendix 2). The report examined data availability and timeliness issues. ETA also contracted with an independent research team to conduct an evaluation of the Workforce Investment Act of 1998. The study, The Workforce Investment Act in Eight States: State Case Studies from a Field Network Evaluation (Study 21 in Appendix 2), examined national goals and the roles of Federal, State, and local partners in implementing the law in eight states. Another independent study, Creating Partnerships for Workforce Investment: How Services are Provided Under WIA (Study 20 in Appendix 2), presents findings from case studies of sixteen local boards across eight states that may help other local boards in developing local systems. Help Trade-Affected Workers Find New Jobs Increase the employment, retention, and earnings replacement of workers dislocated in important part because of trade and who receive trade adjustment assistance benefits. Indicators 88% of those employed in the first quarter after program exit will be employed in the second and third quarters after program exit; and Those who are employed in the third quarter after program exit will earn, on average, 90% of their pre-separation earnings. Program Perspective Results, Analysis and Future Plans
Performance for the above measures is for individuals served under the trade program prior to the Trade Act of 2002 amendments. Performance outcomes for individuals served under the Trade Act of 2002 will not begin to be reported until the fourth quarter of 2004. Reported outcomes will not substantially reflect individuals served under these amendments until FY 2006.
13Performance results for this goal are estimated. The estimating methodology has been reviewed by the Department of Labor's Office of Inspector General. The actual performance results for this goal will be published in the FY 2006 Budget.
The Department is concerned that the 63 percent reported as employed in the first quarter after exit may not reflect actual outcomes for three reasons:
The Department is issuing a directive to States that will provide guidance on these issues and Retention has begun preliminary discussions with the National Dislocated Worker workgroup on methods to follow up with individuals who are 100% not reported as entering employment.
The continuing decreased post-dislocation 70% earnings measure may reflect broader 60% economic conditions. First, employers have a 2001 2002 2003 2004 to Q3 larger qualified worker pool from which to Fiscal Year select, as there has been an increase in the number of Americans obtaining high school diplomas and bachelor's degrees over the past Earnings Replacement year. Second, there was an increase in the supply of labor relative to the demand, putting downward pressure on wages. Third, displaced workers who experience lengthy 90% periods of unemployment typically become increasingly willing to settle for jobs paying 80% less than their previous jobs. In sum, while employment and retention rates remain fairly steady, dislocated workers have been more ready to accept lower-paying jobs and stay Fiscal Year with them until their prospects improve; this has contributed to the decline in the wage replacement performance measure. During Program Year 2003, DOL held six regional forums focused on providing an integrated service system for trade workers. This is part of the Department's effort to improve the alignment of Federal and State processes and response times, and to maximize funding allocations to reach more customers and enhance program results. Currently, DOL is reengineering the process of integrating three programs- National Emergency Grant (NEG), Trade, and Dislocated Worker- to ensure more effective and efficient operations and higher performance outcomes. Management Issues The Department continues to improve the accuracy, timeliness, and reliability of TAA data. In an effort to obtain more current data about the effect of the program on trade affected workers, DOL has initiated a five-year study designed to fully evaluate the implementation of the new provisions of the Trade Reform Act of 2002, as well as the overall effectiveness of the Trade program using the independent services of Social Policy Research. ETA will also consider whether concerns in the GAO report can be examined in this TAA evaluation study. A final study report is expected to be available in FY 2010. DOL will use recommendations of this five-year study to improve future performance and to assess success in implementing the provisions of the Trade Reform Act. The results of this study will also inform the TAA reauthorization process. In response to recommendations from the Program Assessment Rating Tool (PART) review conducted for the FY 2004 budget and updated for the FY 2005 budget, the TAA program will include performance expectations in the agreements between the Secretary of Labor and the States' Governors to encourage better results. Additionally, TAA will adopt the common measures for Federal employment and job training programs, with implementation complete by late FY 2005 or early FY 2006. Use of common measures will align Trade Act program measures with those for the WIA Dislocated Worker program and promote the goals of co-enrollment and coordination between the two programs. Outcome Goal 1.2 — Increase the Number of Youth Making A Successful Transition to Work Even though the median age of the workforce is rising, the percentage of workers between the ages of 16 and 24 is expected to grow more rapidly than the overall labor force for the first time in 25 years. The majority of jobs will continue to require workers who have acquired knowledge and skills via two-year colleges, vocational training, moderate to long-term on-the-job training and real work experience. High school drop-outs are three to four times more likely to be unemployed than college graduates. These statistics help to explain why an important part of DOL's mission is to help disadvantaged youth prepare for competition in a 21st century work environment. DOL administers three programs designed specifically to serve youth: the WIA Youth formula grant program, which provides comprehensive services through local workforce investment areas; Job Corps, an intensive residential training and support program; and the Youth Opportunity Grant demonstration program, which focuses on out-of-school youth in high-poverty communities. Services to in-school youth help them remain in and complete secondary school, move into post-secondary education or advanced training, and ultimately transition into successful careers. Out-of-school youth receive services that provide them with the necessary skills to attain educational credentials (i.e., high school diploma or GED), participate in vocational and post-secondary training opportunities, and transition into gainful employment or a career. Through these programs, our nation makes the type of meaningful investment in at-risk teenagers and young adults that is necessary to help them become productive and self-sufficient members of the nation's workforce. Three performance goals measure DOL's progress in helping youth prepare for entry to the workforce. All three are administered by the Employment and Training Administration (ETA) under the Workforce Investment Act of 1998 (WIA). Funding and reporting are on a Program Year basis, e.g., PY 2003 is July 2003-June 2004.
*For Job Corps, # students
14Due to limited access to State Unemployment Insurance (UI) wage records, data for the older youth entered employment rate and older youth employment retention rate could only be obtained from approximately half of the Youth Opportunity Grantees. The diploma attainment rate, however, includes data from all grantees. Net Cost of Programs
Results Summary Overall, actual PY 2003 performance was better than the goal achievement count alone would indicate. Results in seven of the nine indicators increased — most of them substantially. The WIA Youth program's success in raising all three indicator levels is attributed to extensive technical assistance targeting local performance management issues. Job Corps' diploma attainment rate increase resulted in part from a renewed focus on academic achievement and aggressive new strategies. Hourly wage performance may have been aided by a change in the basis for calculation of wages from initial placement to six months after placement. Youth Opportunity Grant performance was improved by numerous technical assistance strategies that focused on improving long-term employment and education placements.
Future Challenges The Government Accountability Office (GAO) conducted a study entitled Labor Actions Can Help States Improve Quality of Performance Outcome Data and Delivery of Youth Services (Study 10 in Appendix 2). The report recommended that DOL and the US Department of Education coordinate efforts to connect school dropouts to local WIA youth programs and to establish standard monitoring procedures to improve the quality of data reported by states. DOL is implementing these recommendations. The Program Assessment Rating Tool (PART) review of the WIA Youth program, conducted for the FY 2004 budget, recommended an impact evaluation of the WIA Youth program. ETA will commission such a study upon reauthorization, as knowledge of the program's new direction will be critical to the design of any meaningful study. DOL is conducting an impact evaluation of the Youth Opportunity Grant program that is scheduled for completion in 2005. Assist Youth in Making a Successful Transition to Work Increase entrance and retention of youth registered under the WIA youth program in education or employment. Indicators 65 percent of the 19-21 year-old youth will be employed in the first quarter after program exit; and 78 percent of the 19-21 year-old youth employed in the first quarter after exit will be employed in the third quarter after program exit. Program Perspective The three performance indicators were selected from seven WIA youth measures as most appropriate for both in-school and out-of-school youth. For the older youth population, entrance into and retention in employment are the most appropriate indicators of success because services are focused on preparation for and success in the workforce. For the younger youth population, where services are geared toward academic achievement as a means of career preparation, achievement of a diploma or its equivalent is the most meaningful indicator of future success in the workforce. External factors outside of the workforce system, such as secondary school quality and the advent of state standards of learning, have the potential to impact the diploma attainment rate. However, a two year trend shows that the program is making steady progress against its indicators. Strategies and partnerships are continually reviewed to ensure the best service delivery is provided.
Results, Analysis and Future Plans
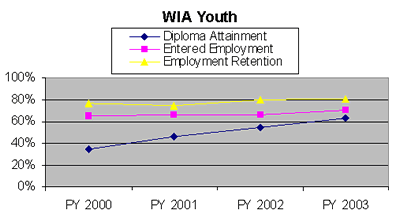
These results for Program Year 2003 (ending June WIA Youth 30, 2004) continue an upward trend that began with WIA implementation in 1998, and are significant. Most important is the continued increase in high school diploma attainment, given 80% the strong statistical correlation between educational attainment and success in the labor 60% 40% market. During PY 2003, DOL provided extensive technical assistance to those states struggling to meet performance goals. This strategy has resulted in improved performance and has yielded valuable information on the specific challenges with which local areas continue to struggle. One example of technical assistance is the Performance Enhancement Project (PEP), which offers a mechanism to identify and address local performance management issues. DOL has also continued to emphasize performance and accountability, including extensive work developing the Common Performance Measures and collaboration with the US Department of Education and with State and local practitioners in developing guidance for their implementation. DOL continues its program of conducting on-site assessments of State and local workforce investment areas to determine the effectiveness of local youth programs and to help regional offices develop strategies to improve program outcomes. DOL will continue its performance improvement efforts by working with its partners to increase emphasis on alternative education, business demands (especially in high-growth industries and occupations), and at-risk youth, including those in foster care, those attached to the juvenile justice system, and migrant youth.
Management Issues The delay of reauthorization of the Workforce Investment Act poses management challenges for the WIA Youth program. The Department of Labor's proposed legislation places emphasis on serving out-of-school youth, and DOL has begun developing strategies to do so. However, because the law currently requires spending just 30 percent of funds on these traditionally expensive to serve out-of-school youth, it will be difficult to implement the new strategies absent reauthorization. The Government Accountability Office (GAO) conducted a study entitled Labor Actions Can Help States Improve Quality of Performance Outcome Data and Delivery of Youth Services (Study 10 in Appendix 2). The report recommended that DOL and the US Department of Education coordinate efforts to connect school dropouts to local WIA Youth programs and to establish standard monitoring procedures to improve the quality of data reported by states. DOL is implementing these recommendations. The Program Assessment Rating Tool (PART) review of the WIA Youth program, conducted for the FY 2004 budget, recommended adoption of common performance measures for Federal job training programs and recommended an impact evaluation of the WIA Youth program. In response, ETA has adopted the four youth common measures in subsequent Performance Budgets and issued guidance to grantees to manage to these goals and measures. States will begin reporting on common measures in November 2005. The impact evaluation will be commissioned upon reauthorization, as knowledge of the program's new direction will be critical to the design of any meaningful study. Increase Placements and Educational Attainments of Youth Improve participation, retention and earnings of Job Corps graduates in employment and education Indicators 65% of graduates will continue to be employed or enrolled in education six months after their initial placement date; and Graduates with jobs at six months after initial placement will earn average hourly wages of $8.20. Program Perspective
Job Corps centers provide services tailored to each student's needs to help them achieve the skills and credentials required to be successful, productive citizens and to obtain work opportunities that lead to long term employment. DOL uses three performance indicators for this program: earning a diploma or its equivalent is the most meaningful indicator of preparedness, while entry to employment and employment retention are appropriate indicators of success in the workforce. Targets are selected by assessing prior experience, and then projecting reasonable performance under anticipated labor market conditions. Results, Analysis and Future Plans
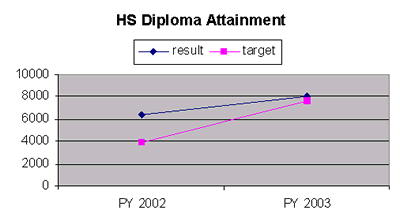
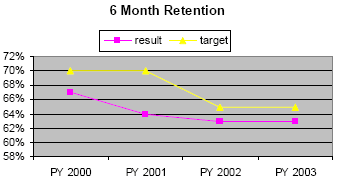
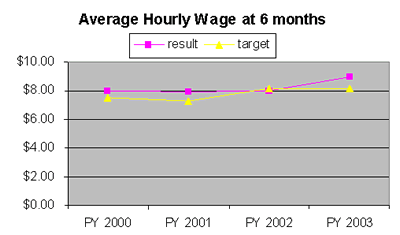
Job Corps' high school diploma attainment rate increased by 25 percent in PY 2003. This HS Diploma Attainment outcome is attributed to a renewed focus on academic achievement and new strategies designed to facilitate students' successful completion of diploma requirements. In PY 2003, while the average hourly wage goal of $8.20 per hour for Job Corps remained the same as PY 4000 2002, the basis for calculation of wages changed 2000 from initial placement to six months later. As in 0 past years, the average hourly wage for Job Corps PY 2002 PY 2003 graduates continues to increase. Average hourly wages at six months for Job Corps graduates were solid, given economic conditions. Moreover, 63 percent were still employed or enrolled in advanced education programs six months later. Job Corps' success in meeting its diploma target is due in large part to numerous partnerships with other youth and adult serving programs: the Department of Education's High School initiative, the former School-to-Work initiative, AmeriCorps, Head Start, Youth Challenge, Youth Build, America's Promise, the Center for Workforce Preparation, and the military. A significant number of the Job Corps centers have also entered into partnerships with local school districts to enable students to earn diplomas. To assist career transition, Job Corps centers are represented on local workforce investment boards and youth councils. Regional assessments and annual contract reviews of center operators and career transition service contractors include compliance measures for operations and performance measures related to student outcomes. Performance based contracting for center operators and career transition service contractors links performance on specific measures of student success to center operators' and contractors' revenues. Implementation of PY 2000 PY 2001 PY 2002 PY 2003 such provisions, for example incentive fees for contractors, has led to improved student outcomes. In addition to improving student outcomes, Job Corps continues to focus on customer needs by maintaining safe and healthy environments at all Job Corps centers by working with other DOL agencies to conduct safety and health inspections.
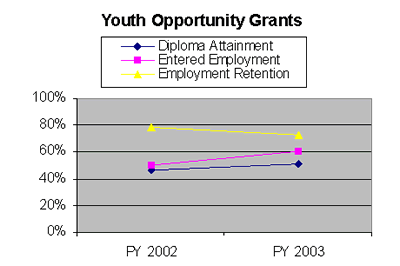
Management Issues Increase Opportunities for Severely Disadvantaged Youth Increase retention of Youth Opportunity Grant participants in education or employment. Indicators 65 percent of the 19-21 year-old youth will be employed in the first quarter after program exit; and 78 percent of the 19-21 year-old youth employed in the first quarter after exit will be employed in the third quarter after program exit.
Program Perspective For the older youth population, services have focused on preparation for and success in the workforce. For the younger youth population, services were geared toward academic achievement as a means of career preparation. Factors such as secondary school quality and the advent of state standards of learning can impact the diploma attainment rate. Many enrollees are high school drop-outs with limited prospects for attaining a high school diploma or long term employment. Another challenge was the program design; YOG was an open enrollment program that accepted any youth willing to enroll. This helped target youth most in need of services, which may have affected completion rates, though results did show improvement from last year. Results, Analysis and Future Plans
Data from State Unemployment Insurance (UI) wage records for the older youth entered employment rate and older youth employment retention rate could only be obtained from approximately half of the Youth Opportunity Grantees. The diploma attainment rate, however, includes data from all grantees. Although the diploma attainment rate and entered employment rate improved markedly from the prior year, all three performance indicators fell short of their targets. Performance targets were set using baseline data from the WIA Youth formula-funded program and goals were identical to that program despite this program's focus on the harder to serve out-of-school youth population. YOGs were able to significantly improve results in diploma attainment and entered employment from the prior year. The diploma attainment improvement is significant given that academic advancement is strongly linked to improved employment opportunities and outcomes, both key long term goals of DOL youth programs. The improvement in placing out of school youth in jobs is also a significant achievement in that youth tend to be harder to employ as the economy begins to recover. Although the employment retention rate decreased from the prior year, performance was slightly below target.
During Program year 2003, DOL focused efforts on a Youth Opportunity Grants number of technical assistance strategies. DOL conducted training sessions on literacy, job development, and homeless and runaway youth. DOL-sponsored Youth Development Practitioner's Institute trained hundreds of front-line YOG staff in areas such as bi-level case management and data management. DOL also convened a strategic planning session and several director meetings that focused on improving areas of performance, especially long-term employment and education placements. Such efforts — coupled with on-site PY 2002 PY 2003 support, regional calls, and other technical assistance — have served to both inform and focus providers on developing effective alternative education and literacy teaching strategies and programs. Through DOL's assistance, YOG-funded programs focused on key progress measures including youth participation, successful completion of goals, and placements in employment and post-secondary education.
Management Issues Outcome Goal 1.3 — Improve the Effectiveness of Information and Analysis On The U.S. Economy America's changing 21st Century workforce needs to know what employment opportunities are emerging to make better informed decisions for their future. This critical information, as well as other information pertaining to the broad field of labor economics and statistics, is available from the Department of Labor's Bureau of Labor Statistics (BLS). BLS provides private citizens, business owners, and public officials with timely and accurate information that assists in making decisions on careers, staffing, and public policy. For example, in FY 2004, BLS released projections to 2012 on future job growth by industry and occupation and on the likely composition of the workforce pursuing those jobs. BLS produces some of the Nation's most sensitive and important economic indicators to serve the needs of the 21st Century workforce.
Net Cost of Programs
Future Challenges To respond to the changing economy:
To maintain a high level of response for its voluntary surveys:
To meet the challenges of evolving technology:
Timely, Accurate, and Relevant Economic Information Improve information available to decision-makers on labor market conditions, and price and productivity changes. Indicators
Improve accuracy (Coverage)
Improve accuracy (Response)
Enhance information technology
Other measures
Program Perspective
Results, Analysis and Future Plans BLS reached its target for converting four data series from the SIC system to the North American Industry Classification System (NAICS) in FY 2004; however, the release of the PPI using the NAICS was delayed. The release of January data, planned for February, took place in March. The Occupational Employment Statistics Survey, Industry Productivity statistics, and the Census of Fatal Occupational Injuries data were converted to NAICS. Targets were reached for improving data coverage in the PPI and in labor productivity measures as BLS continued to improve the accuracy of its data. While the PPI measures average changes in selling prices received by domestic producers for their output, labor productivity is the ratio of the output of goods and services to the labor hours devoted to the production of that output. BLS improved data coverage for calculating the PPI by increasing the percent of service industries covered in the PPI from 38.8 percent (1997 baseline) to 59.2 percent in FY 2004. BLS reached the target, 58 percent, for improving data coverage in labor productivity measures. Additionally, BLS reached the target, 78 percent, for improving response of the ECI initiation indicator. The ECI represents employers' costs for employee compensation, including wages, fringe benefits, and bonuses for U.S. employees in all industries. The NAICS conversion effort of the PPI required a temporary diversion of resources from a systems modernization project, causing BLS to miss its target for completing components of the new repricing system. Seventeen percent of the components were completed as compared to a target of 33 percent. A replanning effort is currently under way to identify and implement strategies to minimize the disruptions. The BLS website receives an average of about 2.5 million user sessions each month, with over half of those sessions directed to the BLS Occupational Outlook Handbook (OOH) website. The OOH is the Bureau's nationally recognized source of career information. Using the American Customer Satisfaction Index (ACSI) survey, the OOH website received a score of 82 in the third quarter of 2004, placing the website in the top 10 percent of government agencies. The aggregated Federal government score for this time period was 71.2. BLS met the timeliness indicator for 104 out of 108 (96 percent) scheduled releases. The four untimely releases were in the PPI program and were caused by above mentioned difficulties with the NAICS conversion. Additionally, BLS met the established accuracy target for 35 out of 42 (83 percent) measures. Targeted response rates were missed for the American Time Use Survey, Current Population Survey, Job Openings and Labor Turnover Survey, U.S. Import and Export Price Indexes (two separate rates), ECI (repricing), and the Employee Benefits Survey. BLS uses various strategies to maintain a high level of cooperation for its voluntary surveys and continues to conduct research studies to better understand the causes of nonresponse. Management Issues In response to the Program Assessment Rating Tool (PART) findings, BLS developed an efficiency measure and revised its performance goals to focus more clearly on outcomes and increase transparency. The BLS PART score improved to 88, receiving an effective rating, the highest rating category. During FY 2004, BLS responded to the Office of the Inspector General (OIG) Government Information Security Reform Act (GISRA) Review of the Current Population Survey (CPS). Findings were related to the CPS Continuity of Operations Plan, CPS System Security Plan, security controls of the CPS, and a Bureau-wide Uninterruptible Power Supply system. The review is described in Appendix 2 of this report (Study 1).
|
||||||||||||||||||||||||||||||||||||||||||||||||||||||||||||||||||||||||||||||||||||||||||||||||||||||||||||||||||||||||||||||||||||||||||||||||||||||||||||||||||||||||||||||
| ||||||||||||||||||||||||||||||||||||||||||||||||||||||||||||||||||||||||||||||||||||||||||||||||||||||||||||||||||||||||||||||||||||||||||||||||||||||||||||||||||||||||||||||