 |
|
|
|
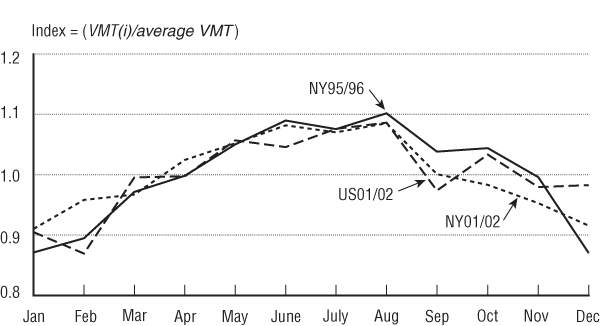
FIGURE 3 Average 2001/2002 and 1995/1996 Statewide Vehicle-Miles of Travel (VMT) Temporal Distribution
Excel | CSV | Table Version
Source: New York State Department of Transportation, Office of Policy and Performance; and U.S. Department of Transportation, Federal Highway Administration.
|
|
|
|
|

