Bureau of Transportation Statistics (BTS)
Printable Version

Figure  7
Proportion of KAB Crashes1 that Occurred Under Wet Pavement Conditions for Each County: 1999

Excel | CSV | Table Version

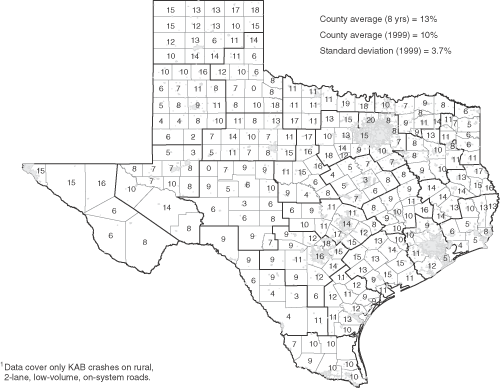
In percent; averaged over 6 neighboring counties

Figure 7 - Proportion of KAB Crashes that Occurred Under Wet Pavement Conditions for Each County: 1999. If you are a user with disability and cannot view this image, use the table version. If you need further assistance, please call 800-853-1351 or email answers@bts.gov.

County average (8 yrs)  = 13% County average (1999) = 10% Standard deviation (1999) = 3.7%

1 Data cover only KAB crashes on rural, 2-lane, low-volume, on-system roads.