|
BTS Supports DOT Goals
BTS statistical programs and activities support the priorities of the U.S. Department of Transportation –
contributing to initiatives in safety, congestion, global connectivity, environmental stewardship, security, and organizational excellence.
Safety
BTS collects data and produces studies on the safety and security of travelers, vehicles, and transportation systems. The Omnibus Household Survey collects data on-demand to provide information on the public’s use and satisfaction with the transportation system, including personal safety and security while traveling. Researchers continue to use data from the 2001-2002 National Household Travel Survey to study the travel habits and demographic data of American business and leisure travelers. The survey provides a comprehensive and detailed look at the public’s use of the nation’s transportation system, including the time, distance, mode, and purpose of travel.
 |
BTS is a key partner in the Confidential Close Calls Reporting System (C3RS) Demonstration Project, a major safety initiative sponsored by the Federal Railroad Administration (FRA) that has required BTS to work closely with railroad management and labor as well as FRA and the Volpe National Transportation Systems Center. Using its unique authority to protect the confidentiality of information collected for statistical purposes and its expertise in data collection and analysis, BTS developed and operates the C3RS. Railroad employees voluntarily submit reports to BTS on close calls that pose safety risks to railroad operations. BTS collects additional details to prepare an incident analysis report and sends the results, with all identifying information removed, to a Peer Review Team at the pilot site. The Peer Review Team reviews the incident report, determines the underlying causes of the close call, and develops recommended corrective actions to prevent further occurrences. Initial reporting from the first pilot site began in February 2007. The demonstration project will expand to include two to three more pilot sites and is planned to last for 5 years.
BTS staff regularly consult and collaborate with DOT agencies and outside organizations on data collection, survey design, and other statistical issues related to safety matters. Recent examples include advising the Federal Motor Carrier Safety Administration on research methods to study improving truck safety, working with the Office of the Secretary of Transportation to estimate the transportation-related economic impacts in the event of a Pandemic Flu, and preparing and distributing maps of structurally deficient bridges in every congressional district in response to the August 1, 2007, bridge collapse in Minnesota.
BTS safety data and analyses are used in a variety of ways. For instance, the AAA (American Automobile Association) and California Department of Health use BTS data to analyze travel patterns, and the Federal Aviation Administration uses BTS data to evaluate airline safety, allocate safety inspection resources, and assess the adequacy of aviation safety regulations, standards, policies, and procedures.
Congestion
BTS studies on travel times and congestion measurement help decisionmakers determine the impact of congestion on the national transportation system and the U.S. economy. These projects cut across all modes: collecting line-haul speeds and terminal dwell times for railroads, reporting travel speeds and forecasting vehicle miles traveled on highways, and estimating the economic costs of congestion across modes.
BTS has developed new ton-mile measures for highways and pipelines so that consistent traffic estimates can be produced throughout DOT. The Bureau works collaboratively with the other DOT modal administrations, such as using Intelligent Transportation Systems (ITS) data from FHWA’s monthly congestion reports to analyze detailed travel time and speed data from 20 urban areas in the United States. Using data from the 2001-2002 National Household Travel Survey, BTS analyzed the percent of private vehicle trips in eight different time blocks, broken down by age groups, gender, rural/urban, income, and trip purpose. BTS also reported on average travel speeds for different age groups, gender, and rural vs. urban drivers.
BTS routinely issues press releases on on-time flight performance of 20 reporting air carriers, including the number of domestic flight cancellations, causes of flight delays, and rate of mishandled baggage per 1,000 passengers. Targeted analyses explain trends in travel, ranging from airline taxi-out delays to the long-term effects of the September 11, 2001 terrorist attacks on air travel.
Global Connectivity
Using a wide variety of data sources, BTS provides a detailed picture of the flow of people and goods to and from the United States. The Bureau compiles, validates, analyzes, and disseminates data on trade trends; movement of goods by land, sea, and air; and personal travel. Several reports on international transportation issues were published in fiscal year 2007, including U.S. North American Trade and Freight Transportation Highlights, a special report on the growth in freight transportation between the United States and its NAFTA partners—Canada and Mexico—and an analysis of passenger travel between the United States and other countries.
Monthly, BTS reports TransBorder freight flow data by commodity type, mode of transportation (rail, truck, pipeline, mail, air, and water), and port of entry/exit for U.S. exports to and imports from Canada and Mexico. Additionally, the Bureau makes available incoming Border Crossing data for vehicles, containers, passengers, and pedestrians for land ports on the U.S. borders with Canada and Mexico. For example, BTS prepared custom tables of the TransBorder and Border Crossing data for FHWA to calculate the fiscal year 2008 apportionment of funds to states under the Coordinated Border Infrastructure Program.
In partnership with the Transportation Research Board, BTS hosted a one-day North American Freight Data Workshop. The workshop fostered an information exchange among a diverse group of users and providers of North American border crossing and trade data. Workshop participants learned about improvements to the TransBorder freight data and Border Crossing data, and BTS staff learned more about the various ways in which the data are used by customers.
During the 2007 fiscal year, BTS continued its leadership role in the 13 year-old North American Transportation Statistics Interchange with Canada, Mexico, and other federal statistical and transportation agencies. In conjunction with this Interchange, BTS oversaw the U.S. efforts to update the North American Transportation Statistics Database, which supplies users with relevant, timely, and comparable transportation data and information for North America.
BTS staff met with the Economic and Trade Policy section of the Canadian Embassy, who were interested in learning about the BTS international trade and transportation data. The Canadian Embassy is interested in creating a more complete picture of the transportation of goods between Canada and the United States than presently exists. BTS staff presented the Canadian visitors with an overview of the Border Crossing data, TransBorder data, and airline data available on the BTS web site, as well as information on the North American Transportation Statistics Interchange. The Canadian Embassy staff plan to use the data provided by BTS in their research on trade and transportation flows between Canada and the United States.
Environmental Stewardship
BTS supports environmental stewardship by working collaboratively with national and international entities to share data and perform analyses. BTS represented the United States at the Energy and Environment Working Group of the North American Transportation Statistics Interchange in Ottawa, Canada. BTS staff are researching and gathering data on energy and environmental indicators for the Interchange’s on-line database. BTS provides statistics and analysis to the DOT Center on Climate Change and Environmental Forecasting, including its project to examine the effects of sea level rise on the nation’s transportation infrastructure. The Bureau also serves as an active member of the technical oversight panel for the Transportation Research Board’s Hazardous Materials Cooperative Research Program.
Other federal agencies rely on BTS products to inform their work related to energy and the environment. The Environmental Protection Agency uses air carrier traffic data provided by BTS to assess the level and frequency of service at American airports in order to determine the environmental noise impact of air-carrier operations. The Environmental Protection Agency also uses BTS air carrier fuel consumption data to estimate the level of greenhouse gases and other aircraft emissions. BTS coordinated monthly reporting on progress in restoring transportation infrastructure in the aftermath of Hurricane Katrina using data from DOT modal administrations, and these reports were released to the Office of the Secretary of Transportation and the Federal Coordinator for Gulf Coast Rebuilding. In fiscal year 2007, Bureau staff also provided quick response research to the White House Council of Economic Advisors on sales of different classes of vehicles, epecially electric hybrids, in response to increases in fuel prices.
Security, Preparedness, and Response
BTS works with agencies within DOT and throughout the government to support efforts to improve the nation’s security, preparedness, and response. BTS staff provided extensive geospatial mapping support for the DOT Crisis Management Center’s (CMC) Exercise Pinnacle 2007, a biennial event held most recently from May 16 to 18, 2007, that comprehensively tests and evaluates our national continuity program’s ability to effectively respond to and recover from a national emergency. Bureau staff began providing support in mid-April in advance of the exercise, and support continued leading up to and throughout the exercise. In total, 14 maps were produced and delivered to the CMC. In addition to Exercise Pinnacle 2007, Geospatial Information Program staff supported the CMC throughout the fiscal year. In total, 53 maps were produced for various transportation incidents, hurricanes/tropical storms, and exercises.
The Department of Defense incorporates the Bureau’s geospatial transportation data into the Homeland Security Infrastructure Protection Program. Additionally, in conjunction with the Transportation Security Administration, BTS developed a special Omnibus Household Survey to assess the general public’s perception of and satisfaction with the nation’s airport security checking procedures, resulting in a forthcoming report entitled American Air Passengers and Their View of U.S. Airport Security Screening Procedures.
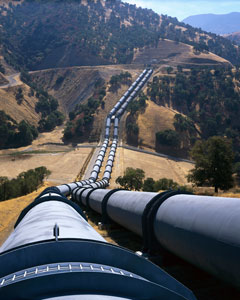 |
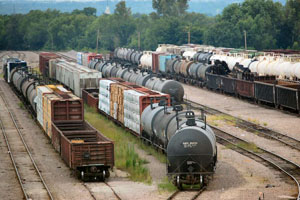
Security and safety are paramount in transporting hazardous materials, especially when shipments travel through major metropolitan areas. According to the Bureau’s Commodity Flow Survey, there were 2.2 billion tons of hazardous materials shipments in the United States in 2002. While the overwhelming majority of shipments arrive without incident, hazardous material shipments sent by pipelines, truck, and trains are vulnerable to accident or attack. In addition to analyzing the Commodity Flow Survey data, BTS has provided consultation to the Pipeline and Hazardous Materials Safety Administration and its work on oil pipeline sampling and hazmat research. The Bureau evaluated the statistical techniques that Pipeline and Hazardous Materials Safety Administration used to study the soundness of a length of the Prudhoe Bay pipeline to determine its readiness for return to service. Additionally, at the request of the Office of the Secretary of Transportation, BTS provided an assessment of a recently developed Hazmat Tracking Service and its proposed application for estimating hazardous materials shipments.
BTS responds to numerous requests for hazardous materials data from the general public, and the Bureau’s data and analyses are used by metropolitan planning organizations, trade associations, and transportation facilities to analyze trends in travel behavior, forecast future travel demands, and determine infrastructure and equipment needs.
Organizational Excellence
The Bureau is dedicated to ensuring its data and analyses are relevant, timely, comparable, complete, accessible, and of high quality. Data users can count on the timeliness of scheduled releases, such as the monthly releases of the Transportation Services Index, TransBorder data, airline traffic and capacity data, airline on-time flight performance data, and the Air Travel Consumer Report. The Bureau also works with other agencies both within and outside the Department to improve the quality of transportation information, including providing consultation to FHWA on their Congestion estimation procedures for the Highway Performance Monitoring System.
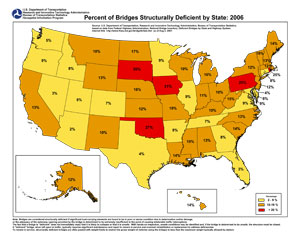 |
BTS provides rapid response research for events and issues in transportation as they develop. BTS staff met with members of the House Transportation and Infrastructure Committee shortly after the August 1, 2007, collapse of the I-35W bridge in Minneapolis to discuss information on structurally deficient bridges available for use by the committee and the general public. Working with committee staff, BTS established a schedule for providing the committee with geospatial maps of structurally deficient bridges for all 435 congressional districts, the 50 states and the District of Columbia, and the nation as a whole. This effort was completed within 4 weeks, and all of the maps and their associated data are currently available to the public on the Committee’s website.
Additionally, BTS staff rapidly produced:
- An analysis for the Office of the Secretary of Transportation on the condition of highway bridges in the United States using the FHWA bridge classification data by year and state;
- Tables on the condition of highway bridges in the United States, using FHWA data, posted on the BTS web site;
- Maps of structurally deficient bridges in the City of Minneapolis and the state of Minnesota for the U.S. House of Representatives Committee on Transportation and Infrastructure and the DOT Crisis Management Center; and
- An analysis of the economic impact on passenger and freight traveling by all transportation modes that were potentially impacted:
highways, water, air, and rail.
Within weeks, BTS published:
- Highway Bridges in the United States—An Overview, a special report explaining characteristics, condition ratings, and spending on bridges; and
- Approximately 500 maps requested by Congress of structurally deficient bridges.
|
|