Air Explorer is a collection of user-friendly visualization tools for air quality analysts.
The tools generate maps, graphs, and data tables dynamically.
Currently, the tools access ambient concentration data from EPA’s Air Quality System (AQS).
The criteria pollutant data were last updated on April 17, 2008. PM2.5 speciation data were last updated on November 2, 2006.
UPDATE (8/22/2008) The PM2.5 speciation data were updated to include data through 2007.
UPDATE (7/3/2008) The AQI graphics now reflect the new ozone AQI break points.
UPDATE (4/17/2008) The criteria pollutant data were updated to provide complete years for 1997 to 2007.
| MAPS |
|
GRAPHS |
|
DATA |
|
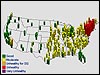 |
Map One Day
Generate a three-dimensional, interactive map of daily pollutant concentrations |
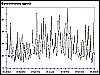 |
Plot Concentrations
Generate a time series plot for a specific location and time period |
 |
Query Concentrations
View or download daily concentrations for a specific location and time period |
|
|
|||||
 |
Map Several Days
Generate an animated series of daily concentration maps for a specific time period |
 |
Plot Speciation Data Plot daily PM2.5 speciation data for a specific location and time period |
|
Query Speciation Data
View or download daily PM2.5 speciation data for a specific location and time period |
|
|
|||||
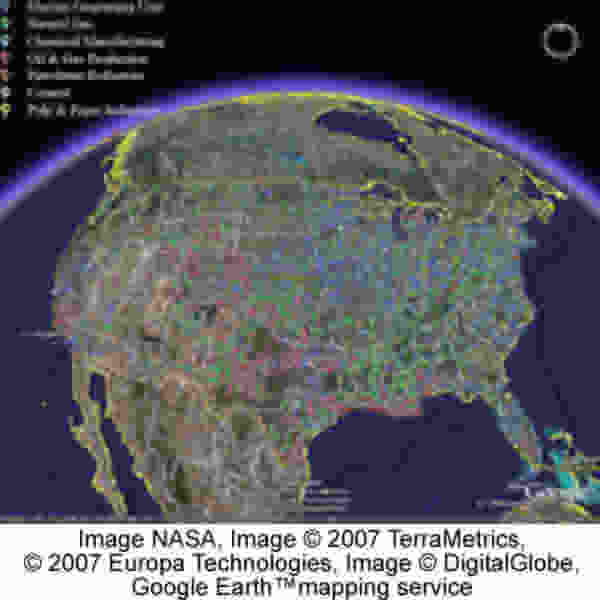 |
Map Monitoring Sites Explore monitoring locations with Google Earth. Download annual and daily data. |
 |
Plot AQI Values Plot PM2.5 and Ozone AQI values for a specific location and time period |
||
|
|
|||||
|
|
|
Tile AQI Values Plot daily AQI values for a specific location and time period |
|
||