Page Options
Media:
Contact Us
- 800–CDC–INFO
- (800-232-4636)
- 888–232–6348 (TTY)
- cdcinfo@cdc.gov
Weekly Report: Influenza Summary Update
2007-2008 Influenza Season Week 40, ending October 6, 2007
(All data are preliminary and may change as more reports are received.)Background
The Centers for Disease Control and Prevention’s (CDC) Influenza Division collects and analyzes surveillance data year-round and produces a weekly report on U.S. influenza activity from October through May. The U.S. influenza surveillance system consists of information in five different categories collected from ten different data sources.
The five categories of influenza surveillance consist of:
- Viral Surveillance: World Health Organization (WHO) collaborating laboratories, the National Respiratory and Enteric Virus Surveillance System (NREVSS), and novel influenza A virus case reporting;
- Outpatient Illness Surveillance: U.S. Influenza Sentinel Provider Surveillance Network and BioSense Department of Veteran’s Affairs and the Department of Defense outpatient treatment facility data;
- Mortality: 122-Cities Mortality Reporting System and influenza-associated pediatric mortality;
- Hospitalizations: Emerging Infections Program and the New Vaccine Surveillance Network; and,
- Summary of geographic spread of influenza: state and territorial epidemiologists’ reports).
A description of surveillance methods is available at: http://www.cdc.gov/flu/weekly/fluactivity.htm
Synopsis
During week 40 (September 30 – October 6, 2007), a low level of influenza activity was reported in the United States.
o Twelve (1.5%) specimens tested by U.S. World Health Organization (WHO) and National Respiratory and Enteric Virus Surveillance System (NREVSS) collaborating laboratories were positive for influenza.
o The proportion of deaths attributed to pneumonia and influenza was slightly above the epidemic threshold.
o The proportion of outpatient visits for influenza-like illness (ILI) was below national and region-specific baseline levels.
o One state reported local influenza activity; eight states and Puerto Rico reported sporadic influenza activity; and 41 states and the District of Columbia reported no influenza activity.
Laboratory Surveillance
From week 21 through week 39 (weeks ending May 26 – September 29), WHO and NREVSS laboratories tested 24,247 specimens for influenza and 511 (2.1%) were positive. Influenza positive tests were reported from eight of the nine public health surveillance regions during the summer. Of the positive results, 103 (20.2%) were influenza A (H1) viruses, 89 (17.4%) were influenza A (H3) viruses, 245 (47.9%) were influenza A viruses that were not subtyped, and 74 (14.5%) were influenza B viruses. More than half (54%) of these isolates were tested from mid-May through late July. Of the 104 influenza viruses reported during September (weeks 36-39), 38 (36.5%) were influenza A (H1) viruses, 3 (2.9%) were influenza A (H3) viruses, 53 (51.0%) were influenza A viruses that were not subtyped, and 10 (9.6%) were influenza B viruses. Among this subset of viruses, 37 (97.3%) of the influenza A (H1) viruses and 10 (100%) of the influenza B viruses were reported from the Pacific region.
During week 40, WHO and NREVSS laboratories reported 787 specimens tested for influenza viruses, 12 of which were positive: 11 influenza A viruses that were not subtyped (South Atlantic and West South Central regions) and one influenza B virus (South Atlantic region).

View Chart Data | View Full Screen
Antigenic Characterization
Of the isolates collected from May 20 – September 29, CDC antigenically characterized 14 isolates including two influenza A (H1), ten influenza A (H3) viruses, and two influenza B viruses. Both of the influenza A (H1) viruses were antigenically similar to A/Solomon Islands/3/2006, the H1N1 component of the 2007-08 influenza vaccine. Of the ten influenza A (H3) viruses that were characterized, six (60%) were antigenically similar to A/Wisconisin/67/2005, the H3N2 component of the 2007-08 influenza vaccine. Two (20%) of the influenza A (H3) viruses were antigenically similar to A/Brisbane/10/2007, and two (20%) had reduced titers to A/Wisconsin/67/2005 and A/Brisbane/10/2007. A/Brisbane/10/2007 is a recent antigenic variant related to the A/Wisconsin/67/2005 vaccine virus.
Currently circulating influenza B viruses can be divided into two antigenically distinct lineages that have co-circulated worldwide since March 2001, represented by B/Yamagata/16/88 and B/Victoria/02/87 viruses. The B component of the 2007-08 influenza vaccine belongs to the B/Victoria lineage. The two influenza B viruses collected during May 20 – September 29 and characterized at CDC both belonged to the B/Yamagata lineage.
Novel Influenza A Virus
Three human cases of novel influenza A infection were reported from two states (Ohio (2) and Illinois (1)) in September. All three persons were infected with swine influenza A virus. Although human infection with swine influenza is uncommon, sporadic cases occur in many years, usually among persons in direct contact with ill pigs or who have been in places where pigs might have been present (e.g. agricultural fairs, farms, or petting zoos). The sporadic cases identified in recent years have not resulted in sustained human-to-human transmission or community outbreaks. Nonetheless, when sporadic cases are identified, CDC recommends thorough investigations to evaluate the extent of the outbreaks and possible human to human transmission as transmission patterns may change with changes in swine influenza viruses.
No novel influenza A virus infections were reported for week 40.
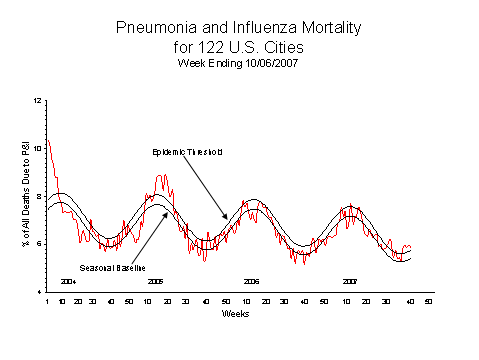
Pneumonia and Influenza (P&I) Mortality Surveillance
During week 40, 5.9% of all deaths reported through the 122-Cities Mortality Reporting System were reported as due to pneumonia or influenza. This percentage is above the epidemic threshold of 5.8% for week 40. This is the fifth consecutive week that the percentage of deaths due to pneumonia or influenza has been above the epidemic threshold. However, no other component of the national surveillance system showed evidence of increased influenza activity or virus circulation. Potential explanations for the increase in pneumonia and influenza mortality above threshold are being investigated.
View Full Screen
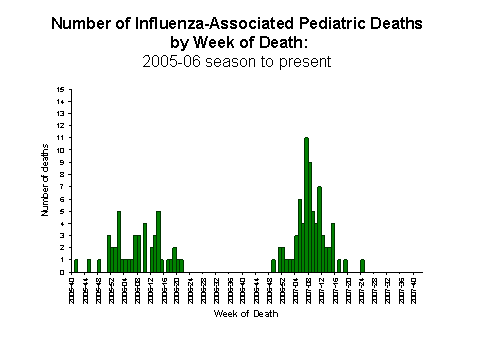
Influenza-Associated Pediatric Mortality
No influenza-associated pediatric deaths were reported for week 40.
View Full Screen
Influenza-Associated Pediatric Hospitalizations
Laboratory-confirmed influenza-associated pediatric hospitalizations are monitored in two population-based surveillance networks: the Emerging Infections Program (EIP) and the New Vaccine Surveillance Network (NVSN). EIP estimated rates of hospitalization for influenza will be reported every two weeks beginning October 26, 2007. NVSN estimated rates of hospitalization for influenza will be reported every two weeks, beginning November 30, 2007.
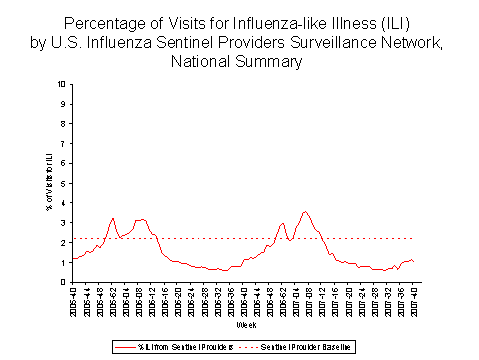
Outpatient Illness Surveillance
During week 40, 1.0% of patient visits reported through the U.S. Influenza Sentinel Provider Surveillance Network were due to influenza-like illness (ILI). This percentage is less than the national baseline of 2.2%. On a regional level, the percentage of visits for ILI ranged from 0.5% to 2.0%. All nine regions reported percentages of visits for ILI below their respective region-specific baselines.
Data on outpatient visits to Department of Veteran’s Affairs and Department of Defense outpatient treatment facilities for acute respiratory illness collected by BioSense will be included in future reports.
View Chart Data | View Full Screen
Geographic Spread of Influenza as Assessed by State and Territorial Epidemiologists:
Influenza activity was reported as local in one state (Hawaii) and sporadic in eight states (California, Florida, Illinois, Indiana, Louisiana, Oregon, New York, and Utah) and Puerto Rico. Forty-one states and the District of Columbia reported no influenza activity.

View Full Screen
--------------------------------------------------------------------------------
- Page last updated October 12, 2007
- Content Source: Coordinating Center for Infectious Diseases (CCID)
- National Center for Immunization and Respiratory Diseases (NCIRD)