|
The Department of Labor's (DOL) FY 2007 Performance Budget reflects the
continuing effort to improve the integration of the Department's performance
objectives with resource requirements into a performance-budget submission. The
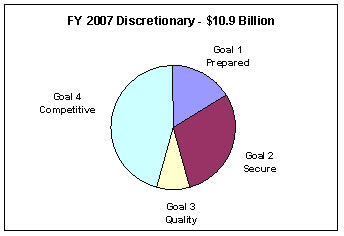
FY 2007 request is $10.9 billion in discretionary budget authority and 16,822
full-time equivalents employees (FTE).
The FY 2007 performance budget builds upon the Department's FY 2003-2008
Strategic Plan goals of A Prepared Workforce, A Secure Workforce, Quality
Workplaces, and A Competitive Workforce. This performance budget
meets the Annual Performance Plan requirement under the Government Performance
and Results Act of 1993, and sets out specific annual performance targets and
the strategies to attain them.
Because of the variety of Departmental agency missions and their
extensive and wide-ranging performance goals, this Overview section provides
key agency goals that will be reflected in the Department's FY 2007 Annual
Performance and Accountability Report. Appendix I provides changes to goals
included in the FY 2006 Performance Budget Overview and to Program Year 2005
goals. These goals will be reported in the FY 2006 Performance and
Accountability Report. Appendix II indicates changes in Program Year 2006 goals
from the FY 2006 Performance Budget Overview that will be reported in the FY
2007 Performance and Accountability Report.
The Department's FY 2007 budget format has been updated to provide a
streamlined and consolidated presentation of program performance information as
it relates to the DOL's strategic goals. Performance goals and targets, prior
year results, Program Assessment Rating Tool (PART) evaluations and
recommendations, and agency efficiency measures are now provided in an
easy-to-find Performance Chapter for each of the Department's
agencies. This revised approach allows the reader a single source of
performance information and associated resources in a clear and concise manner
in accordance with the requirements of the Government Performance and Results
Act of 1993. The Department will continue to seek improvements to this
performance-budget information.
The mission of DOL is to promote the welfare of the Nation's job
seekers, wage earners, and retirees by improving working conditions, enforcing
the Fair Labor Standards Act, expanding opportunities for training and
employment, protecting retirement and health care benefits, helping employers
find qualified workers, strengthening free collective bargaining, and tracking
changes in employment, prices, and other national economic measurements.
The FY 2007 budget submission focuses on the following Departmental
priorities:
- Continuing the Department's commitment to enforcement while also
expanding agencies' compliance assistance programs as part of a comprehensive
effort to protect workers.
- Effectively reaching, serving and protecting immigrant workers.
- Restructuring our workforce training programs to train more workers
and to more effectively prepare them for high-growth job opportunities.
- Protecting union members' rights through enhanced disclosure and
financial oversight of union finances.
- Examining base funding to shift resources from lower priority, less
effective programs, to higher priority, more effective programs.
- Using information technology applications to more effectively enhance
program performance, measure results, reduce administrative costs and increase
accessibility to customers.
In addition to these program-specific priorities, the Department has
been making steady and significant progress in implementing the President's
Management Agenda (PMA) and the Program Assessment Rating Tool (PART). As of
June 30, 2005, DOL has become the first, and only, Department to attain
Green scores in all five government-wide PMA initiatives: Human
Capital, Competitive Sourcing, Financial Performance, E-Government, and Budget
and Performance Integration. On September 30, 2005 the Department also
achieved a Green score in Eliminating Improper Payments; the
Department's Faith-based and Community Initiative, and Real
Property initiatives have Yellow status scores with
Green in progress.
The Department has also been conducting PART reviews of key programs,
and implementing their recommendations. Twenty-eight programs have been
reviewed to date, and agencies are using PART recommendations to improve
performance measures and targets, develop efficiency measures, and focus
program evaluations. A more detailed discussion of the PMA and PART can be
found at the conclusion of the Performance Budget Overview. Agency budget
submissions include program-related discussion of PART reviews and displays of
recommendations and implementation status.
To accomplish the Secretary's priorities in FY 2007, DOL will use its
resources to accomplish four strategic goals and supporting outcome goals.
These goals embrace the range of authorized employment and labor programs
administered by the Department. As shown in the following table, the FY 2007
DOL request of $10.9 billion in discretionary budget authority represents a
$.566 billion decrease, or a 5.2 percent decrease from FY 2006.
Goal 1—A Prepared Workforce: Enhance
opportunities for America's workforce
Outcome Goal 1.1 —
Increase Opportunities for new and re-emerging entrants to the workforce
Outcome Goal 1.2 — Improve the Effectiveness of Information and
Analysis on the U.S. Economy
Goal 2—A Secure Workforce: Promote the
economic security of workers and families
Outcome Goal 2.1 —
Increase compliance with worker protection laws
Outcome Goal 2.2
— Protect worker benefits
Goal 3—Quality Workplaces: Foster quality
workplaces that are safe, healthy and fair
Outcome Goal 3.1 —
Reduce workplace fatalities, injuries, and illnesses
Outcome Goal
3.2 — Foster equal opportunity workplaces
Goal 4—A Competitive Workforce: Maintain
competitiveness in the 21st century economy
Outcome
Goal 4.1 — Build a demand driven workforce system
Outcome
Goal 4.2 — Promote job flexibility and minimize regulatory burden
FY 2007 DOL Request
(Dollars in Billions) |
|
|
FY 2006 |
FY 2007 |
Change |
|
Discretionary: |
$11.5 |
$10.9 |
-$0.5 |
|
Mandatory: |
$39.8 |
$43.2 |
+$3.4 |
|
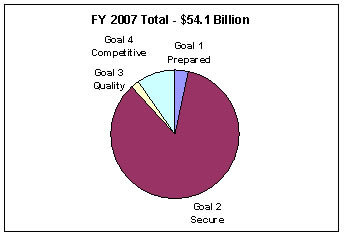
Total |
$51.3 |
$54.1 |
+$2.8 |
|
Full Time Equivalents (FTE) |
16,719 |
16,822 |
+103 |
The following charts illustrate how the FY 2007 DOL Request supports
each Strategic Goal:
The Department has included several increases in its
FY 2007 submission that support the outcome goals identified above.
The following table identifies selected initiatives, the amount included
in the FY 2007 budget request, and the outcome goals they support:
|
Agency |
Initiative |
FTE |
Amount (000s)
|
|
Outcome Goal 1.1 — Increase
opportunities for new and re-emerging entrants to the workforce
|
|
ETA |
Prisoner Re-entry Initiative (second year) |
0 |
$19,642 |
|
Outcome Goal 1.2 — Improve the
Effectiveness of Information and Analysis on the U.S. Economy
|
|
BLS |
Introduce Continuous Updating of the Housing and Geographic Area
Samples in the Consumer Price Index |
15 |
$8,000 |
|
Outcome Goal 2.2 — Protect worker
benefits |
|
ETA |
Unemployment Insurance Reemployment and Eligibility Assessment
|
0 |
$30,000 |
|
ETA |
Unemployment Insurance Fraud and Identity Theft |
0 |
$10,000 |
|
EBSA |
Develop Wholly Electronic EFAST System for Receipt and Processing
of Form 550 Annual Reports |
0 |
$5,000 |
|
PBGC |
Develop Wholly Electronic EFAST System for Receipt and Processing
of Form 550 Annual Reports |
0 |
$7,000 |
|
PBGC |
Enhanced Risk Management Insurance Supervision and Compliance
|
0 |
$2,534 |
|
PBGC |
Increased Plan Termination Workload |
0 |
$2,980 |
|
PBGC |
Increase in Investment Management Fees |
0 |
$3,767 |
|
PBGC |
Increased Operational Support |
0 |
$4,100 |
|
ESA |
Enhanced Enforcement Staff (WHD) |
39 |
$6,000 |
|
ESA |
Office of Labor Management Standards (OLMS) Enforcement |
22 |
$4,520 |
|
ESA |
Information Technology Infrastructure Replenishment |
0 |
$400 |
|
Outcome Goal 3.1 — Reduce workplace
fatalities, injuries, and illnesses |
|
MSHA |
Mine Rescue Technology |
0 |
$1,000 |
|
OSHA |
Develop Occupational Safety and Health Information System
|
0 |
$7,500 |
|
OSHA |
Increase Compliance Assistance Efforts Targeted at Hispanic and
other non-English Speaking Workers |
0 |
$2,616 |
|
Outcome Goal 4.1 — Build a demand
driven workforce system |
|
ETA |
Foreign Labor Certification Permanent Program |
0 |
$6,000 |
|
ETA |
Community-Based Job Training Grants |
0 |
$150,000 |
Included in the request is an account restructuring plan that would
provide a single fund source to provide Career Advancement Accounts (CAA) to
individuals in need of workforce investment assistance, primarily out-of-school
youths, low-income adults, and dislocated workers.
The four strategic goals and supporting outcome goals are in turn
supported by performance goals and measures. The performance goals form the
basis of the annual targets and associated strategies and resource requirements
and are presented in greater detail within the agency performance-budgets. The
Department will measure the key agency goals identified below for determining
performance accomplishment in FY 2007.
A strong national economy depends, in part, on preparing new entrants to
the workforce, such as out-of-school youth and ex-offenders reentering society,
to be qualified job candidates who possess the skills that are demanded by
employers. Many industries and sectors of the economy will be adding new jobs
in the coming years or transforming their business processes, requiring new and
different worker skills. To ensure a prepared American workforce, innovative
approaches to workforce development and strong partnerships between the
workforce system, business and industry, and education and training programs
will be required.
How well the Department performs in assuring A Prepared Workforce will
be assessed by targeting accomplishments for programs and initiatives
supporting these two broad outcomes:
- Increasing opportunities for new and re-emerging entrants to the
workforce.
- Improving the effectiveness of information and analysis on the
U.S. economy.
Agencies supporting this strategic goal are the Employment and Training
Administration, Veterans' Employment and Training Service, the Bureau of Labor
Statistics, the Women's Bureau, the Office of Disability Employment Policy and
the Civil Rights Center.
For A Prepared Workforce, the Department will concentrate resources
toward preparing those segments of the workforce that do not yet have the
experience, skills or training needed to compete and succeed in their work
life. In FY 2007, the Department proposes to dedicate $2.4 billion of its
discretionary budget authority for agency-specific strategies supporting this
strategic goal. These strategies include $1.5 billion for training and
employment programs in the Employment and Training Administration, $204.1
million for training and employment programs targeted at veterans through the
Veterans' Employment and Training Service, and $563.3 million for funding
dedicated to improving the effectiveness of information and analysis on the
U.S. economy in the Bureau of Labor Statistics.
A critical aspect in ensuring a prepared workforce is developing a
pipeline of workers with the skills and credentials necessary to fill the jobs
of the 21st century. Strengthening the registered apprenticeship program will
ensure that skilled workers are continually entering productive careers and
accessing job opportunities in growth industries. Programs such as Job Corps,
Youthbuild, and the Prisoner Reentry Initiative will prepare new and
re-emerging entrants to the workforce with the skills needed to enter career
pipelines.
Strategies for Outcome Goal 1.1 include:
- Expand apprenticeship opportunities.
- Help ex-offenders rejoin society and find employment through the
Prisoner Re-entry Initiative.
- Improve performance accountability.
- Create more business partnerships.
- Develop more intergovernmental partnerships.
- Demonstrate and assess new ways to assist veterans find jobs.
- Improve educational achievements of Job Corps students.
- Increase participation of Job Corps and Youthbuild participants in
employment and education.
- Disseminate information and influence disability employment policy
and practice.
The performance measures and indicators related to this outcome goal
evaluate the results of our employment and training services — they
address whether new and re-emerging participants obtain employment, remain
employed, receive higher wages, as well as assess educational achievement and
attainment of literacy and numeracy skills.
Outcome Goal 1.1 — Increase opportunities for new and
re-emerging entrants to the workforce
|
Performance Goal DOL-07-1.1A: Strengthen the registered
apprenticeship system to meet the training needs of business and workers in the
21st Century (ETA) |
|
Indicators*:
- Retention: Percent of those employed nine months after
registration as an apprentice
Baseline: (FY 2005) 78%
Target: 78%
- Earnings increase: Average wage gain for tracked entrants**
employed in the first quarter after registration and still employed nine months
later.
Baseline: (FY 2005) $1.26
Target: $1.26
* Because apprentices are employed by definition, no entered
employment measure is proposed for apprenticeship programs.
**23 states are federally-registered apprenticeship programs and
enter data on individuals into the Registered Apprenticeship Information System
(RAIS). A group of "tracked entrants" is defined as the cohort of apprentices
registered and entered into RAIS during a given reporting period. |
|
Performance Goal DOL-07-1.1B: Advance knowledge and inform
disability employment policy that affects systems change throughout the
workforce development system. (ODEP) |
|
Indicators:
- Number of policy related documents disseminated
Baseline: FY 2006
Target: TBD
- Number of formal agreements initiated
Baseline: FY 2006
Target: TBD
- Number of effective practices identified
Baseline: (FY 2004) 10
Target: 10% increase of FY 2006 Actual |
|
Performance Goal DOL-07-1.1C: Improve educational
achievements of Job Corps students, and increase participation of Job Corps
graduates in employment and education (ETA\PY 2007) |
|
Indicators:
- Percent of Job Corps participants entering employment or
enrolling in post secondary education and/or advanced training/occupational
skills training in the first quarter after exit
Baseline: (PY 2004) 84%
Target: 87%
- Percent of students who attain a GED, high school diploma, or
certificate by the end of the third quarter after exit
Baseline: (PY 2004) 64%
Target: 65%
- Percent of students who achieve literacy or numeracy gains of
one or more Adult Basic Education (ABE) levels
Baseline: (PY 2004) 47%
Target: 49% |
|
Performance Goal DOL-07-1.1D: Assist ex-offenders in
successful reintegration into the community in remaining crime-free citizens
through preparation for and placement into the workforce (ETA)
|
|
Indicators: The program will use common measures
of entered employment, retention, earnings, and cost per (efficiency), as well
as a measure of recidivism, yet to be determined
- Entered employment: Percent of participants who are unemployed
at the time of registration employed in the first quarter after program
exit
- Retention: Percent of participants employed in the first
quarter after program exit who are still employed in both the second and third
quarters after program exit
- Earnings: Average earnings in the second and third quarter
after exit
- Recidivism: Recidivism rate for participants
Baseline: PY 2005 — PY
2006
Targets: Entered employment: TBD
Employment
retention: TBD
Earnings increase: TBD
Recidivism: TBD |
|
Performance Goal DOL-07-1.1E: Increase employment
opportunities and improve the educational achievement of youth participating in
the Youthbuild program (ETA\PY 2007) |
|
Indicators:
- Percent of youth who enter employment or enroll in post
secondary education and/or advanced training/occupational skills training or
the military in the first quarter after exit
- Percent of students who attain a GED, high school diploma, or
certificate by the end of the third quarter after exit
- Percent of basic-skills-deficient students who achieve literacy
or numeracy gains of one or more Adult Basic Education (ABE) level
Baseline: (PY 2006) Placement and
degree attainment measures;
(PY 2006-2007) Literacy/numeracy measure.
Targets: TBD — Placement and degree attainment
measures;
establish baseline for Literacy/numeracy measure |
|
Performance Goal DOL-07-1.1F: Improve the employment
outcomes for veterans who receive One Stop Career Center services and
veterans’ program services (VETS\PY 2007) |
|
Indicators:
- Veterans: Percent of Veteran job seekers employed in the first
or second quarter following registration
Baseline: (PY 2003) 58%
Target: 60%
- Veterans: Percent of Veteran job seekers still employed two
quarters after initial entry into employment with a new employer
Baseline: (PY 2003) 79%
Target: 82%
- Disabled veterans: Percent of Disabled Veteran job seekers
employed in the first or second quarter following registration
Baseline: (PY 2003) 53%
Target: 56%
- Disabled veterans: Percent of Disabled Veteran job seekers
still employed two quarters after initial entry into employment with a new
employer
Baseline: (PY 2003 estimate) 77%
Target: 80%
- Homeless veterans: Entered employment rate for homeless
veterans participating in the Homeless Veterans' Reintegration Program
(HVRP)
Baseline: (PY 2003) 61%
Target: 62%
- Homeless veterans: Employment retention rate after 6 months for
homeless veteran HVRP participants
Baseline: (PY2004)* 58%
Target: 59%
* Based on three quarters’ data. |
The 21st century requires public officials, business owners, and private
citizens to be knowledgeable about trends in the global, national, and local
economies. They need access to up-to-date, high-quality information and
statistics to formulate public policy, negotiate a purchasing agreement, or
decide what field to pursue as a career. In all of these cases, people need
sound data to make sound decisions.
The Department plays a crucial role in public and private
decision-making processes by producing statistics that are relevant, timely,
and accurate. Using the ongoing strategies described below, the Department will
identify the most promising types of improvements, ranging from updating a
statistical methodology to expanding the geographical scope of a data series to
designing an entirely new survey. In addition, the Department will identify
ways to improve the accessibility and usability of the data through enhanced
dissemination methods.
Strategies for Outcome Goal 1.2 include:
- Better inform the public.
- Build value through innovation.
- Continually assess program priorities.
- Collaborate with other statistical agencies.
- Address respondents' concerns and burden.
The Department's statistical programs produce detailed information about
the labor force, prices, compensation, and productivity that individuals,
corporations, and public policymakers rely upon. The Interagency Council on
Statistical Policy's Guidelines for Reporting Performance by Statistical
Agencies provides guidance on measuring and reporting on statistical
program performance. Relevancy, timeliness, and accuracy are identified as
critical aspects of performance, as is achieving customer satisfaction with
statistical products and services.
Statistical program continuous improvements are shown through setting
ambitious targets for relevancy, timeliness and accuracy measures. All of these
efforts support and track progress in improving information available to
decision-makers.
Outcome Goal 1.2 — Improve the effectiveness of information
and analysis on the U.S. economy
|
Performance Goal DOL-06-1.2A: Improve information
available to decision-makers on labor market conditions, and price and
productivity changes (BLS) |
|
Performance Measures
|
Performance Targets |
|
|
'05 |
'06 |
'07b |
|
The percent of output, timeliness, accuracy, and long-term
improvement targets achieved for labor force statistics.a |
82% |
85% |
85% |
|
The percent of output, timeliness, accuracy, and long-term
improvement targets achieved for prices and living conditions.a
|
87% |
85% |
85% |
|
The percent of output, timeliness, accuracy, and long-term
improvement targets achieved for compensation and working
conditions.a |
95% |
85% |
85% |
|
The percent of output, timeliness, accuracy, and long-term
improvement targets achieved for productivity and technology.a
|
100% |
85% |
85% |
|
Enhance efficiency and effectiveness Cost per transaction of the
Internet Data Collection Facility (2004 baseline = $6.13)c |
$2.44 |
$2.58 |
$2.45 |
|
Raise customer satisfaction with BLS products and services (e.g.,
the American Customer Satisfaction Index) [2001 baseline =
74%]d |
74% |
75% |
75% |
aThe BLS revised its performance measures in
its 2007 budget submission. Results for 2005 are shown for comparative purposes
only.
bThe 2007 targets are subject to change based on 2006
results.
cThe 2005 result is lower than out year targets
because, due to periodic replacement cycles, fewer costs were incurred.
dThe BLS measures users' satisfaction with the Occupational Outlook
Handbook website.
Central to the DOL mission are retirement security; compliance
assistance and enforcement toward protecting workers' wages and working
conditions; providing unemployment compensation and other benefits when workers
are unable to work; and expanding, enhancing, and protecting workers'
retirement plans, health care plans, and other benefits. The strategic goal of
A Secure Workforce captures these priorities and consists of two outcome goals,
which focus on safeguarding employees' wages, working conditions, and union
democracy and financial integrity; and assistance in the form of unemployment,
disability, and pension and health care insurance benefits.
- Increase compliance with worker protection laws.
- Protect worker benefits.
Agencies supporting this strategic goal are the Employment and Training
Administration, the Employment Standards Administration, the Employee Benefits
Security Administration, and the Pension Benefits Guaranty Corporation.
The Department proposes $3.3 billion of discretionary budget authority
in FY 2007 to conduct programs and activities that support A Secure
Workforce. These programs include $2.7 billion for state unemployment
insurance administration and other ETA programs, $348.7 million for ESA
workforce protection programs, $143.2 million for EBSA to protect the nation's
pension and health insurance system, and health insurance system, and $397.6
million of mandatory funds for PBGC to provide payments to participants (over
$3 billion in FY 2005) in terminated defined-benefit pension plans and assist
at-risk multiemployer plans.
While our commitment to protecting worker wages, hours, and benefits is
steadfast, our approach focuses on expanding compliance assistance initiatives
to help employers comply with the Department's regulations. Compliance
assistance, combined with a strong enforcement program targeted to the most
hazardous worksites and industries, will help prevent violations, leverage the
Department's resources, and position the DOL to deal with emerging challenges.
Protecting vulnerable populations, and protecting and expanding pension
and health care coverage will continue to be key issues. Since continuing
changes in the dynamic U.S. economy are not expected to remove or lessen
workers' risk of experiencing unemployment, the Unemployment Insurance (UI)
system must continue to adapt to the changing character of the workforce, job
market, and nature of unemployment itself.
The continued growth in Internet use and increased networking
capabilities have encouraged American businesses to shift from traditional
"brick and mortar" organizational structures to business operations with lines
of authority stretching across the globe. Traditional methods of tracking,
analyzing, and reporting on employer personnel practices often do not align
with current business models. In addition, the Nation will continue to rely on
foreign workers to fill employers' needs in low-wage, labor-intensive
industries such as agriculture, garment, health care, guard and janitorial
services, restaurants, hotel/motels and day-haul. Low-wage industries that
employ large numbers of vulnerable workers, including young workers, are
characterized by consistently high violation rates of minimum wage, overtime
and child labor requirements. Protecting the most vulnerable workers will
continue to be a key focus.
Achieving health care and retirement security is becoming more complex,
due to changing workforce characteristics and economic conditions. Both
employees and employers are facing rising health care costs, further
emphasizing the need for affordable, secure health coverage. In addition, the
once-common defined benefit pension plan is giving way to defined contribution
plans — pre-tax individual savings accounts such as 401(k)s. For workers,
this shift means taking on more responsibility for retirement savings and
planning, including making investment decisions and managing investment risks.
The profile of workplace injuries has changed along with the changing
economy, requiring new disability management and vocational rehabilitation
approaches. In some Federal agencies, the number of jobs available to
recovering injured workers is declining and the average age of workers is
rising. In general, a 21st century Federal workforce will require that its
workers upgrade their skills. These factors make assisting return-to-work and
reducing disability time loss in workers' compensation cases a greater
challenge for the Department.
The Department is committed to guaranteeing an honest day's pay for an
honest day's work for employees — particularly the most economically
disadvantaged and vulnerable workers. This includes administration of the Fair
Labor Standards Act (FLSA), which establishes minimum wage, overtime pay,
recordkeeping, and child labor standards affecting full-time and part-time
workers. This also includes administration of the Migrant and Seasonal
Agricultural Worker Protection Act (MSPA), which regulates the hiring and
employment activities of agricultural employers, farm labor contractors, and
associations using migrant and seasonal agricultural workers. Through its
administration and enforcement of the Labor-Management Reporting and Disclosure
Act (LMRDA), the Department ensures union democracy, financial integrity and
transparency.
In the FY 2007 request supporting this outcome goal are program
increases in the following areas:
- $6 million for ESA's Wage and Hour Division to Enhance Compliance and
Regulatory Staff which will increase worker protections in low-wage
industries.
- $4.5 million for the Office of Labor Management Standards enforcement
to support new compliance reporting efforts and to support the new
Labor-Management Reporting and Disclosure Act criminal enforcement
responsibilities.
- $.4 million for ESA IT infrastructure to allow Program Direction and
Support to more effectively support and assist the programs in ESA to fulfill
their missions.
Strategies for Outcome Goal 2.1 include:
- Protect workers through compliance assistance.
- Create more knowledgeable employees through outreach and
education.
- Target enforcement efforts.
The performance goals associated with this outcome goal are:
American workplaces legally employ and compensate workers and ensure union
financial integrity, democracy and transparency..
Outcome Goal 2.1 — Increase compliance with
worker protection laws
|
Performance Goal DOL-07-2.1A: American workplaces legally
employ and compensate workers (ESA) |
|
Indicators: Covered American workplaces legally,
fairly, and safely employ and compensate their workers.
- Maximizing the impact of complaint investigations by increasing
the number of workers for whom there is an agreement to pay or an agreement to
remedy per 1,000 enforcement hours
Baseline: FY 2006
Target: TBD
- Reducing employer recidivism by increasing the percent of prior
violators who achieved and maintained Fair Labor Standards Act (FLSA)
compliance following a full FLSA investigation
Baseline: (FY 2004) 71%
Target: 74%
- Increasing compliance in low-wage industries by increasing the
percent of low-wage workers across identified low-wage industries paid and
employed in compliance with FLSA
Baseline: FY 2006
Target: TBD
- Ensuring timely and accurate prevailing wage determinations by
increasing the number of wage determination data submission forms processed per
1,000 hours
Baseline: 1,491
Target: 1,536
- And increasing the percent of survey-based DBA wage
determinations issued within 60 days of the receipt of the underlying survey
data
Baseline: (FY 2002) 100%
Target: 83% |
|
Performance Goal DOL-07-2.1B: Ensure union financial
integrity, democracy, and transparency (ESA) |
|
Indicators:
- Union financial integrity: Percent of unions with fraud
Baseline: (FY 2004) 9%
Target: 7.5%
- Union democracy: Percent of unions complying with standards for
democratic union officer elections
Baseline: FY 2006
Target: TBD
- Union transparency: Percent of union reports meeting standards
of acceptability for public disclosure
Baseline: (FY 2003) 73%
Target: 97% |
Protecting workers' benefits is a key component of the Department's goal
to promote the economic security of workers and their families. The Department
will continue to take steps to strengthen the UI system, which serves as a
safety net for unemployed workers and their families. The FY 2007 Budget
includes a legislative proposal to reduce UI overpayments and increase
overpayment recoveries and delinquent tax collections.
Specific increases in the FY 2007 request supporting this outcome goal
include:
- $10 million for ETA for Unemployment Insurance Identity Theft.
- $30 million for Reemployment and Eligibility Assessments.
- $12 million for EBSA to develop a modern electronic filing-based
system to receive and process vital pension and health information (ERISA
Filing and Acceptance System — EFAST2) — a key element in its
employee pension and health benefits security mission.
Depending on the rate of economic recovery and the performance of
financial investment, more pension plans may be trusteed under the
administration of the Pension Benefit Guaranty Corporation over the next five
years. In addition, the transition of more Americans to 401(k) and managed
health care plans will place more of the burden for retirement savings and
health care choices on employees. Finally, the workers' compensation programs
administered by DOL face the same challenge as the Nation. An increasingly
aging population and rising health care costs will increase the focus on these
programs, resulting in efforts to improve program efficiency.
Strategies for Outcome Goal 2.2 include:
- Provide oversight and assistance to States.
- Improve information access and analysis.
- Create more knowledgeable consumers through outreach and
education.
- Streamline processing.
- Assist return to work through better coordination of medical
treatment.
Performance goals associated with this outcome goal are Make timely
and accurate payments to unemployed workers and facilitate their reemployment;
Minimize impact of work-related injuries; Enhance employee pension and health
benefits security; and Improve pension payment processing.
Outcome Goal 2.2 — Protect worker benefits
|
Performance Goal DOL-07-2.2A: Make timely and accurate
benefit payments to unemployed workers and facilitate their reemployment of
Insurance claimants, and set up Unemployment tax accounts promptly for new
employers (ETA) |
|
Indicators:
- Payment Timeliness: Percent of intrastate first payments made
within 21 days
Baseline: (FY 2001) 89.1%
Target: 90.0%
- Detect Overpayments: Establish for recovery a percent of the
amount of estimated overpayments that States can detect and recover.
Baseline: (FY 2002) 57.9%
Target: 60.0%
- Facilitate Claimant Reemployment: Percent of UI claimants who
were reemployed by the end of the first quarter after the quarter in which they
received their first payment
Baseline: FY 2006
Target: TBD
- Establish Tax Accounts Promptly: Percent of new employer
liability determinations made within 90 days of the end of the first quarter in
which they become liable.
Baseline: (FY 2001) 79.1%
Target: 82.8% |
|
Performance Goal DOL-07-2.2B: Minimize the impact of
work-related injuries (ESA) |
|
Indicator:
- Lost production days (LPD) rate (LPD per 100 employees) for
FECA cases of the United States Postal Service
Baseline: (FY 2003) 147.6 days
Target: 145 days
- Lost production days rate (LPD per 100 employees) for FECA
cases of All Other Government Agencies
Baseline: (FY 2003) 56 days
Target: 59 days
- Savings resulting from Periodic Roll Management case
evaluations
Baseline: NA
Target: $13m
- FECA medical treatment cost containment
Baseline: Nationwide cost trend per
Milliman USA HCI
Target: Remain below Milliman USA HCI
- Communication targets achieved
Targets: Meet all of the five
following targets:
Use of FECA program electronic services — 2.838
million contacts
Average Caller wait times — 2.9 minutes
Average
time to return calls — 2.4 days
Calls resolved on the first try —
70%
Calls handled according to program quality standards — 95%
- Days required to resolve disputed issues in Longshore and
Harbor Worker's compensation Program contested cases
Baseline: (FY 2005) 253 days
Target: 248 days
- Percent of Black Lung Benefit claims filed under the revised
regulations for which, following an eligibility decision, there are no requests
for further action from any party pending one year after receipt of the claim
Baseline: (FY 2001) 66.5%
Target: 80%
- Percent of initial claims for benefits in the Part B and Part E
Energy Programs processed within standard timeframes
Baseline: FY 2006
Target: TBD
- Percent of Final Decisions in the Part B Energy Program
processed within standard timeframes
Baseline: 75%
Target: 80%
- Percent of EEOICPA Part E claims backlog receiving Recommended
Decisions
Baseline: FY 2006
Target: TBD |
|
Performance Goal DOL-07-2.2C: Enhance Employee Pension and
Health Benefits Security (EBSA) |
|
Indicators:
- Achieve a 72% ratio of closed civil cases with corrected
violations to civil cases closed
Baseline: (FY 1999-2001 Average)
46.04%
Target: 72%
- Achieve a 42.7% ratio of criminal cases referred for
prosecution to total criminal cases
Baseline: (FY 1999-2001 Average)
23.45%
Target: 42.7%
- Achieve a Customer Satisfaction Index of 67, or comparable
measurement, for participants and beneficiaries who have contacted EBSA for
assistance
Baseline: (FY 2003) 59
Target: 67
- Achieve 9,195 applications to Voluntary Compliance
programs
Baseline: (FY 2001-2003 Average)
7,564
Target: 13,500 |
|
Performance Goal DOL-07-2.2D: Improve pension insurance
program (PBGC) |
|
Indicators:
- Pension Practitioner Service: Achieve a Customer Satisfaction
score of 76 for practitioner callers in FY 2007
Baseline: (FY 2002) 69
Target: 76
- Participant Service: Achieve a Customer Satisfaction score of
80 for responding to trusteed plan participants' inquires in FY 2007
Baseline: (FY 2001) 73
Target: 80 |
The goal of quality workplaces requires that American work environments
are safe, healthy, and fair. Achievement of this goal requires the use of
complementary strategies of the compliance assistance, enforcement, and
education, outreach, and training. Each of the Quality Workplaces goal
elements are further defined with results targets in two broad outcome goals:
- Reducing workplace injuries, illnesses, and fatalities.
- Fostering equal opportunity workplaces.
Agencies supporting this strategic goal are the Occupational Safety and
Health Administration, the Mine Safety and Health Administration, the
Employment Standards Administration, and the Veterans' Employment and Training
Service.
OSHA and MSHA represent the agencies with the largest share of the
Department's budget resources dedicated to supporting Quality Workplaces. In FY
2007 the Department requests $0.9 billion in discretionary budget authority to
support this strategic goal, including, $483.7 million for OSHA programs and
$287.8 million for MSHA programs.
Significant progress has been made in protecting workers from
occupational safety and health threats. In the past thirty years occupational
injury and illness rates have declined 56 percent. However, the Department
continues to confront a variety of challenges. The number of workers DOL is
responsible for protecting has expanded dramatically, nearly doubling during
this period, from 58 million workers at 3.5 million worksites to 111 million
workers at 7.25 million establishments. Rapid technological advances and
dynamic workplace environments have changed the nature of work, creating new
health and safety challenges. For example, emerging safety and health threats
include fall hazards from wireless communication and HDTV tower construction
and occupational asthma and exposures to new chemicals. The Department's
strategies for reducing workplace hazards have not traditionally addressed
these segments of the workforce. Changes in workplace demographics create an
increasing challenge to work place safety and health — the increase of
immigrant and hard-to reach workers, a growing percentage of young workers,
those continuing to work at an older age, and the rapidly increasing number of
temporary workers.
The mining environment, whether underground or surface, is complex and
ever-changing. Unseen geologic instabilities, constantly changing terrain, and
the prevalence of large and complex haulage and mining equipment are a few of
the factors that make maintaining mine safety a continuing challenge.
Equality and fair play are central values in our national life. DOL
promotes these values through its administration of anti-discrimination and
equal employment opportunity regulations for Federal contractors and
subcontractors, who employ more than 20 percent of the labor force in America
or approximately 26 million workers. Many Federal contractors have demonstrated
their commitment to equal opportunity and have adopted inclusive human resource
policies and procedures at all levels. Notwithstanding this past success,
discrimination still exists in the workplace and Federal contractors may still
need assistance to meet their affirmative action obligations.
Improving the safety and health of the American workplace must be done
in partnership with workers, employers, and other levels of government. Each
shares responsibility to seek out and employ the best workplace safety
practices as the conditions and demands of an evolving economy warrant.
The Department strives to make American workplaces the safest in the
world. Over the last several years, the Department has sought to create a
commitment to workplace safety and health by both employers and workers. We are
encouraged by the progress that they have made in reducing workplace injuries
and illnesses. Nevertheless, significant hazards and unsafe conditions continue
to exist in the workplace.
The Department will reach and maintain a healthy balance among
enforcement, education and training, which includes compliance assistance and
technical support, while improving our leadership role in the national safety
and health dialogue, expanding outreach, and expanding opportunities for
voluntary and cooperative programs. We will work to ensure that employers have
access to DOL resources to assist them in preventing workplace injuries and
illnesses. DOL plans to identify the most critical safety and health problems
and create strategies to address them. The FY 2007 request for OSHA includes an
increase of $7.5 million to begin development of a new Occupational Safety and
Health Information System (OIS) to replace OSHA's outdated Integrated
Management Information System. The OIS will provide a modern information system
that supports all agency programs and activities. In addition, OSHA has
requested an increase of $2.6 million for compliance assistance efforts
targeted at Hispanic and other non-English speaking workers. MSHA is requesting
an additional $1.0 million for technology to enhance its mine rescue
capability.
Strategies for Outcome Goal 3.1 include:
- Strong, effective and fair enforcement.
- Expand outreach, education, and compliance assistance efforts.
- Encourage partnerships and voluntary programs.
The performance goals related to this outcome goal directly measure
reductions in workplace injuries, illnesses and fatalities, across general
industries and specifically mining. Exposures to health hazards, such as noise
and respirable dust, are also measured in the mining industry.
Outcome Goal 3.1 — Reduce workplace
injuries, illnesses, and fatalities
|
Performance Goal DOL-07-3.1A: Reduce work-related
fatalities and injuries (MSHA) |
|
Indicator:
- Fatal injury incidence rate — fatalities per 200,000 hours
worked
Baseline (FY 2003): 0.0229
Target (FY 2007): 0.0201
- All-injury incidence rate — injuries per 200,000 hours
worked
Baseline (FY 2000): 5.07
Target (FY 2007): 2.82 |
|
Performance Goal DOL-07-3.1B: Reduce mining-related
illnesses (MSHA) |
|
Indicators:
- Percent of respirable coal mine dust samples exceeding the
applicable standard (for designated occupations).
Baseline: (FY 2003/2004) 10.6%
Target: 9.0%
- Improve respirable silica dust sampling effectiveness by
identifying occupations with overexposures as measured by an increase in the
percent of silica dust samples taken with at least 50% of the permissible
exposure limits in metal and nonmetal mines
Baseline: (FY 2005) 16.3%
Target: 17.9%
- Improve noise sampling effectiveness by identifying occupations
with overexposures as measured by an increase in the percent of noise samples
with at least 50% of the permissible exposure limits taken in metal and
nonmetal mines
Baseline: (FY 2005) 20.9%
Target: 23%
- Percent of noise exposures above the citation level in coal
mines
Baseline: 5.3%
Target: 4.8% |
|
Performance Goal DOL-07-3.1C: Reduce work-related
fatalities (OSHA) |
|
Indicator: Reduce the rate of workplace
fatalities by 12 percent from baseline. (OSHA)
Baseline: (FY 2000 — 2002
average) 1.62 fatalities per 100,000 workers
Target: (FY
2005-2007 average) 1.43 fatalities per 100,000 workers |
|
Performance Goal DOL-07-3.1D: Reduce work-related injuries
and illnesses (OSHA) |
|
Indicator: Reduce the rate of workplace injuries
and illness by 16 percent from baseline. (OSHA)
Baseline: (CY 2002) 1.6 days away
from work cases per 100 workers
Target: (CY 2007) 1.3 days
away from work cases per 100 workers |
DOL is committed to fostering workplaces that are free of discrimination
and that guarantee equal opportunity and fairness to working Americans. The
Department monitors Federal contractors' compliance with applicable laws and
executive orders, and ensures that minorities, women, individuals with
disabilities, and eligible veterans are afforded equal opportunity to compete
for employment and advancement. The Department believes that the best method to
achieve equal opportunity workplaces is by focusing resources on finding and
resolving systemic discrimination, a pattern or practice of unlawful
discrimination involving a significant number of workers. The Department has
developed goals that emphasize the use of compliance assistance as a component
of its enforcement strategy for informing Federal contractors of their
obligations and in helping Federal contractors comply with those requirements.
The Department also protects the civilian employment rights and opportunities
of members and veterans of our military services.
Strategies for Outcome Goal 3.2 include:
- Monitor and vigorously enforce compliance with federal equal
employment opportunity laws.
- Enhance compliance assistance for Federal contractors.
- Minimize the disadvantages to civilian employment that can result
from uniformed service.
The performance goals related to this outcome goal measure decreases in
employment discrimination rates among Federal contractors resulting from OFCCP
activities, and the extent to which program activities lower the barriers faced
by military personnel in the civilian workforce. Achieving these goals will
help ensure that all of America's workers have equal opportunities to compete
for and achieve rewarding employment free of discrimination.
Outcome Goal 3.2 — Foster equal opportunity
workplaces
|
Performance Goal DOL-07-3.2A: Federal contractors achieve
equal opportunity workplaces (ESA) |
|
Indicators:
- Discrimination rate among Federal contractors
Baseline FY 2001: 12.5%
Target: 5.5%
- Compliance rate among Federal contractors in all other aspects
of equal opportunity workplace standards
Baseline FY 2001: 57%
Target: 65% |
|
Performance Goal DOL-07-3.2B: Reduce employer-employee
employment issues originating from service members’ military obligations
conflicting with their civilian employment (VETS) |
|
Indicator: USERRA Progress Index (measures
compliance progress and assistance progress)
Compliance Progress: 1) Number of Guard/Reserve
de-mobilized per USERRA claim filed by Guard/Reserve; 2) Number of
Guard/Reserve de-mobilized per USERRA claim filed by Guard/Reserve in primary
issues; 3) Number of USERRA violations; 4) Number of USERRA violations in
primary issues; 5) Number of meritless USERRA claims; 6) Number of meritless
USERRA claims in primary issues; and 7) Average days cases remain in VETS
jurisdiction
Assistance Progress: Number of USERRA assistance contacts
per Guard/Reserve mobilized and de-mobilized
Baseline: USERRA Progress Index =
100 (FY 2005)
Target: 110% |
A Competitive Workforce addresses the workforce challenges
facing the nation in the 21st century and consists of two outcome goals:
- Build a demand driven workforce system.
- Promote job flexibility and minimize regulatory burden.
Our first outcome goal — Build a demand driven workforce system to
address worker shortages and equip workers to adapt to the competitive
challenges of the 21st century — focuses on workforce gaps that are likely
to occur, including labor shortages for new and replacement workers, with an
emphasis on knowledge workers. The second — Promote job flexibility and
minimize regulatory burden — focuses on adopting innovative approaches for
establishing an effective regulatory environment and expanding workplace
flexibility that are consistent with the changing nature of work in the 21st
century. This goal is supported by the full complement of DOL agencies.
The world has become dramatically more interconnected and competitive.
Advances in the fields of communication, technology and travel have effectively
removed national borders as barriers to global commerce. Competition now comes
from the company across the ocean as well as the company across the street. To
compete successfully, we must have a workforce that creates new products, makes
better products, and brings them to the market faster.
Our country's economic development and competitive advantage depend on
the competitiveness of our workforce. To succeed, our policies must embrace the
emerging changes in our economy — in how we actually work, where we work,
what skills we need, and how we balance our professional and family lives. The
needs of the 21st century economy are very different than those we have
encountered in the past. Industries such as manufacturing and retail now need
workers who understand computers and robotics and supply chain management.
Fields such as health care and construction need more technical and skilled
labor than ever before. Newer industries — for example, biotechnology and
geospatial technology — have emerged, and others will emerge in the
future.
The fastest growing jobs of the future will need to be filled by
"knowledge workers," who have specialized skills and training. In fact, the
demand for knowledge workers is already growing at an astonishing pace. The
fastest growing jobs, on average, require a postsecondary credential, that is,
a vocational certificate, other credential, an associate or higher degree.
These are the jobs that will drive innovation and determine which countries
will lead the world economy.
While employers and workers bear ultimate responsibility for adapting to
these challenges, DOL has a leadership responsibility to support the needs of
the changing workforce and position the U.S. for continued economic development
and growth. The knowledge-based workplace will require a higher level of
technical skills creating opportunities for many to succeed, but carrying the
potential for some to fall farther behind. For a competitive workforce the
Department will concentrate resources on those workforce segments that have
work experience and skills, but who also need skill upgrades, desire to shift
industries or occupations, or need help in readjusting to the changing
economy.
At the same time, an increasingly competitive and global economy will
put pressure on our regulatory environment. Historically, we developed our
labor policies and programs under conditions of labor surpluses and based our
employment laws and regulations on traditional, full-time, long-term work
arrangements. Over the next two decades, the relevance of these, and other
assumptions will be challenged.
The Department requests $4.2 billion in discretionary budget authority
in FY 2007 for programs that strive to maintain competitiveness in the 21st
century economy.
As the 21st century unfolds, the American workforce
will evolve into something different. Three powerful forces will transform the
workforce and the manner in which we work:
- An increasingly global economy.
- A sharp increase in the demand for knowledge workers.
- Greater use of alternate work arrangements that do not fit the
traditional work model.
These forces have significant implications for our economy and the way
DOL approaches its mission. Our challenge is to anticipate these changes to
ensure that our programs and regulatory processes address contemporary work
environment issues in a forward-looking way that contributes to economic
growth, changing technology, and the changing workplace.
The shift to knowledge work will reinforce the ongoing trend of
"non-traditional" work arrangements. Today, few workers can count on spending
their entire careers within one company. A recent BLS press release from the
National Longitudinal Survey states that "individuals held an average of 10.2
jobs from ages 18-38." Full-time, stable, long-term employment arrangements
will continue to decline. Instead, a growing number of workers will be
part-timers, temporaries, consultants, or contractors.
Competing demands for Americans' time are also increasing. Among the
world's industrialized nations, only the workers of Australia and Korea report
working more hours than American and Japanese workers. Many workers are
struggling to meet their family obligations, which have expanded in many cases
to taking care of their elderly parents. Consequently, the need to balance work
demands and home life will continue to be a growing concern.
DOL has made significant progress advancing labor issues for many years.
However, for us to provide essential leadership to meet future challenges, we
are shifting to a more forward-looking role that emphasizes:
- Identifying high-growth industries and the career ladders they
offer.
- Promoting training in industries with skill shortages through grants
for training in community and technical colleges.
- Focusing on success by reforming Federal job training and employment
programs.
- Offering better, faster foreign labor certification.
- Fostering a competitive economic environment.
- Implementing practical, effective regulations and regulatory
approaches.
The nation's future success will largely depend on our ability to
continue to meet the needs of employers for new and skilled workers. To this
end, DOL is committed to ensuring that the workforce investment system is
responsive to the changing needs of business and is focused on linking job
seekers with opportunities in high growth industries. DOL will strengthen
partnerships among the workforce investment system, business and industry,
education and training providers, and economic development agencies. These
partnerships are critical to understanding the skills demanded by the labor
market and will enable the Department to make informed investments in job
training. Furthermore, DOL will take the necessary steps to ensure that tools
and information are available to help match workers with employers. Finally,
the workforce investment system will reach out to every available worker,
particularly those in special target populations, to ensure there are enough
skilled workers and to help maintain the nation's competitiveness.
The Department's ability to contribute to maintaining a competitive
workforce will be assessed through our efforts to address worker shortages in
sectors of the American economy and build a demand-driven workforce system,
with particular emphasis on assisting high growth industries. Included in this
outcome goal is $150 million for a third year of funding for the Community
College Initiative to provide for Community-Based Job Training Grants.
To make our programs more comprehensive and supportive of the needs of
youth, adults, and business, we have adopted the following new principles and
strategies to guide our programs:
Strategies for Outcome Goal 4.1 include:
- Increase individual control over employment and training decisions
and equip individuals with the information they need to develop the knowledge,
skills, and abilities sought by the new economy.
- Strengthen partnerships among the workforce investment system,
business and industry, education and training providers, and economic
development agencies.
- Increase employment opportunities for people in targeted populations,
such as older workers, Hispanic workers, and individuals with disabilities, in
order to help meet the needs of business for skilled workers.
- Build a demand-driven workforce system that is able to anticipate and
respond to changes in the economy.
- Strengthen Foreign Labor Certification programs in order to help
address worker shortages.
Many of the challenges described in Outcome Goal 4.1 will impact the
Nation more significantly in the years beyond the current strategic plan
timeframe. The major activities under Goal 4 include Foreign Labor
Certification, Trade Adjustment Assistance, Career Advancement Accounts, the
Senior Community Employment Service Program, Community-Based Job Training
Grants, and National Electronic Tools.
Career Advancement Accounts, which will replace separate funding streams
for WIA Adult, Youth, Dislocated Worker and Employment Service programs, go
beyond consolidation; they represent a major shift in the Department's service
delivery method. Grants that supported State Workforce Agency programs will be
directed instead to eligible individuals who must use the funds to pay for
education and training. The benefits of this demand-driven strategy are
enhanced choice and lower administrative costs.
In addition to other performance measures, the primary indicators for
Goal 4 activities are the common measures of entered employment, employment
retention, and earnings gain, as highlighted below.
|
Performance Goal DOL-07-4.1A: Address worker shortages
through the Foreign Labor Certification Program (ETA) |
|
Indicators:
- Percent of H-1B applications processed within seven days of the
filing date for which no prevailing wage issues are identified
Baseline: 99%
Target: 100%
- Percent of employer applications for labor certification under
the streamlined system that are resolved within six months of filing
Baseline: (FY 2005) 57%
Target: 65
- Percent of H-2B applications processed within 60 days of
receipt
Baseline: FY 2006
Target: 95%
- Percent of H-2B applications processed within 60 days of
receipt
Baseline: 70%
Target: 90% |
|
Performance Goal DOL-07-4.1B: Assist workers impacted by
international trade to better compete in the global economy through the Trade
Adjustment Assistance Program (ETA) |
|
Indicators:
- Entered Employment: Percent of participants employed in the
first quarter after program exit
Baseline: (FY 2001) 65%*
Target: 70%
- Retention: Percent of participants employed in the first
quarter after program exit still employed in the second and third quarters
after program exit
Baseline: (FY 2001) 90%*
Target: 85%
- Earnings: Average earnings in the second and third quarter
after exit
Baseline: FY 2007
Target: TBD
*Baseline data are based on slightly different measure
definitions. |
|
Performance Goal DOL-07-4.1C: Improve opportunities for
employment, retention, and earnings increases through Career Advancement
Accounts (ETA) |
|
Indicators*:
- Percent of participants employed in the first quarter after
program exit
- Percent of participants employed in the first quarter after
program exit who are still employed in both the second and third quarters after
program exit
- Earnings: Average earnings in the second and third quarter
after exit
Baselines: PY 2007
Targets: TBD
*Proposed consolidation will require collection of new baseline
information, including cost per individual, since the number of individuals and
services provided is likely to change as a result of the
consolidation. |
|
Performance Goal DOL-07-4.1D: Assist older workers to
participate in a demand-driven economy through the Senior Community Service
Employment Program (ETA\PY 2007) |
|
Indicators:
- Entered Employment: Percent of participants employed in the
first quarter after program exit
Baseline: (PY 2004) 36%
Target: 57%
- Retention: Percent of participants employed in the first
quarter after program exit still employed in the second and third quarters
after program exit
Baseline: PY 2004
Target: 67%
- Earnings: Average earnings in the second and third quarter
after exit
Baseline: PY 2004
Target: To be established upon receipt of PY 2004
data |
|
Performance Goal DOL-07-4.1E: Build a demand-driven
workforce system through Community Based Job Training Grants (ETA\ PY
2007) |
|
Indicators: The Community College
Initiative/Community Based Job Training Grants will be funded for the first
time in PY 2005, as authorized and appropriated through the FY 2005 Omnibus
Appropriations Act. Baseline data will be collected over PY 2006 and PY
2007.
- Entered Employment: Percent of participants employed in the
first quarter after program exit
- Retention: Percent of participants employed in the first
quarter after program exit still employed in both the second and third quarters
after program exit
- Earnings: Average earnings in the second and third quarter
after exit
Baselines: PY 2006 and 2007
Target: TBD |
|
Performance Goal DOL-07-4.1F: Increase accessibility of
workforce information through the National Electronic Tools (ETA\PY
2007) |
|
Indicators:
- Increase number of page views on America's Career InfoNet
Baseline: PY 2005
Target: Increase by 2% over baseline
- Increase the dissemination of O*NET data measured by site
visits
Baseline: (PY 2003) 2,767,655
Target: 4,151,483
- Increase the number of page views on Career Voyages
Baseline: PY 2005
Target: 10% over baseline |
Many employers, to compete more effectively in the highly competitive
global economy, have restructured their companies, downsized their workforces,
and increasingly relied on non-traditional employment practices that include
part-time, temporary, and contractor-supplied workers. Experts expect these
non-traditional work arrangements to increase substantially in coming decades.
At the same time, on average, Americans are working more hours and many have
difficulty balancing work demands with their personal lives.
We need to promote the greater flexibility desired by workers and
employers. This includes examining and possibly adjusting our regulatory
environment — employment related laws, regulations and regulatory
practices — in light of non-traditional work arrangements and the need to
reduce regulatory burden. In particular, some regulations written decades ago
may no longer be applicable or effective; they may impose costs on employers
without yielding any corresponding benefits to the workforce.
Strategies for Outcome Goal 4.2 include:
- Assess and revise regulations.
- Re-analyze our regulatory approaches to reduce regulatory
burden.
- Promote flexible work practices.
The performance goal related to this outcome of promoting job
flexibility and minimizing regulatory burden while protecting workers centers
around taking a comprehensive and strategic approach toward our ability to
influence the work environment and implement a new regulatory infrastructure.
Many of the indicators represent key steps in analyzing the changes needed and
are therefore more output oriented during the current strategic planning cycle.
Outcome-oriented performance goals will be developed after new policies and
programs have been implemented based on the results of the proposed
evaluations.
Outcome Goal 4.2 — Promote job flexibility
and minimize regulatory burden
|
Performance Goal DOL-07-4.2A: Maximize regulatory
flexibility and benefits and promote flexible workplace programs (ASP)
|
|
Indicators: Wage and hour, worker safety, pension
and health care regulations, to the greatest extent practicable, are
performance-based and provide maximum flexibility to employers in developing a
compliance approach.
- Review identified significant regulations and develop
revisions
Target: Initiate rulemaking as
appropriate
New and current regulations maximize net benefits. Regulations
that impose greater societal costs than benefits are revised, consistent with
applicable governing statutes
- Regulations identified for revisions or withdrawals as
appropriate
Target: Initiate rulemaking as
appropriate
- Best practices for, and models of, flexible workplace practices
are identified and publicized
Baseline: Develop best practices
studies
Target: Best practices disseminated |
In 2001, the Administration implemented the President's Management
Agenda (PMA), designed to help agencies improve management performance. The
five government-wide PMA initiatives are:
- Strategic Management of Human Capital
- Competitive Sourcing
- Improved Financial Performance
- Expanded E-government
- Budget and Performance Integration
DOL is also participating in three program initiatives that apply only
to selected Federal
Departments and Agencies:
- Faith-Based and Community Initiative
- Real Property
- Elimination of Improper Payments
In order to measure progress against demonstrated goals, PMA portfolio
managers were asked to identify where they would be proud to be in their
respective PMA components as of July 1, 2005 and yet again as of July 1, 2006.
In turn, Federal agency leadership was tasked with identifying separate
Proud to Be goals related to PMA implementation. The Department set
ambitious but reachable goals for its PMA implementation, and on June 30, 2005
the Department of Labor became the first, and only, organization to achieve
Green status scores on all five government-wide President's Management
Agenda components. DOL also increased its standing in the agency-specific
initiatives by achieving Yellow status and Green progress
score for its implementation of the Faith-based and Community
initiative and Real Property, and on September 30, 2005 achieved a
Green score in Elimination of Improper Payments.
|
|
Current Status |
Progress |
|
Human Capital |
Green
 |
Green
|
|
Competitive Sourcing |
Green
|
Green
|
|
Financial Performance |
Green
|
Green
|
|
E-Government |
Green
|
Green
|
|
Budget & Performance Integration |
Green
|
Green
|
We recognize our work on PMA implementation is far from over. We must
continue to meet new and more challenging commitments on the five
government-wide PMA components and improve our standing in the three
agency-specific initiatives.
In preparation for the FY 2007 budget, seven Department of Labor
programs were evaluated using the Program Assessment Rating Tool (PART). The
outcomes of these evaluations underline DOL's efforts to produce results for
American employees and employers. Of these programs, one was rated Moderately
Effective; four were rated Adequate, and two were rated as Results Not
Demonstrated.
The 28 DOL programs that have been evaluated from CY 2002 — CY 2005
through the PART process represent roughly 72% of its programs, with the
remaining programs scheduled for evaluation in the next budget cycle. The
positive impact of PART on DOL management is evident in many ways, especially
in program planning and internal evaluation. Together with the President's
Management Agenda, the PART has created an incentive for a more transparent
government.
|
DOL PART RATINGS AND RANKINGS*
|
|
Program |
CY 2002 |
CY 2003 Rating |
CY 2004 Rating |
CY 2005 Rating |
|
BLS |
Moderately Effective |
Effective |
|
|
|
ESA/FECA |
Moderately Effective |
|
|
|
|
OSHA |
Adequate |
|
|
|
|
EBSA |
Results Not Demonstrated |
|
Moderately Effective |
|
|
ETA/Trade Adjustment Act |
Results Not Demonstrated |
Ineffective |
|
|
|
ESA/OFCCP |
Results Not Demonstrated |
|
Adequate |
|
|
ETA/Dislocated Workers |
Results Not Demonstrated |
Adequate |
|
|
|
ETA/Youth Activities |
Results Not Demonstrated |
Ineffective |
|
|
|
ETA/Older Americans |
Results Not Demonstrated |
Ineffective |
|
|
|
ESA/Black Lung |
|
Moderately Effective |
|
|
|
ETA/UI Administrative Grants |
|
Moderately Effective |
|
|
|
MSHA |
|
Adequate |
|
|
|
ETA/Migrant & Seasonal Farmworkers |
|
Ineffective |
|
|
|
ESA/WHD Davis-Bacon Act |
|
Results Not Demonstrated |
|
|
|
ETA/Job Corps |
|
|
Moderately Effective |
|
|
ETA/Native Americans Program |
|
|
Adequate |
|
|
ETA/Employment Service |
|
|
Adequate |
|
|
ETA/Foreign Labor Certification (H-1B) |
|
|
Moderately Effective |
|
|
ETA/Foreign Labor Certification (PERM) |
|
|
Adequate |
|
|
PBGC |
|
|
Moderately Effective |
|
|
ILAB |
|
|
Adequate |
|
|
ETA/Adult Employment and Training |
|
|
|
Adequate |
|
ETA/Apprenticeship Training |
|
|
|
Results Not Demonstrated |
|
ETA/Work Incentive Grants |
|
|
|
Adequate |
|
ESA/Office of Labor Management Standards |
|
|
|
Adequate |
|
ESA/Longshore |
|
|
|
Adequate |
|
Women's Bureau |
|
|
|
Results Not Demonstrated |
|
VETS/Disabled Veterans' Outreach Program/Local Veterans Employment
Programs |
|
|
|
Moderately Effective |
*Programs do not undergo a PART review each year; some programs receive
a follow-up PART if additional information is considered significant.
Agency Efficiency Measures
As of September 30, 2005 Efficiency Measures with baselines and targets
have been developed for all PARTed programs. These have been included in agency
budget submissions, per the requirements of the President's Management Agenda.
The Department will continuously improve program effectiveness and efficient
use of taxpayer dollars through the use of performance measurement.
This Appendix shows the Department of Labor FY 2006 and PY 2005 goals.
This Appendix includes goals that have been updated or revised from
those presented in the FY 2006 Performance Budget Overview as well as the new
goals. These updated FY 2006 goals are included here in order to provide a list
of the final goals of record. These goals, which include Program Year 2005
(July 1, 2005-June 30, 2006) goals for ETA and VETS, will be reported in the FY
2006 Performance and Accountability Report.
Strategic Goal 1 — A Prepared Workforce:
Enhance opportunities for America’s workforce
Outcome Goal 1.1 — Increase opportunities
for new and re-emerging entrants to the workforce
|
Performance Goal DOL-05-1.1A: Increase placements and
educational attainments for youth served through the WIA youth program (ETA\ PY
2005)1 |
|
Indicators:
- Percent of youth who are in employment or the military or
enrolled in post secondary education and/or advanced training/occupational
skills training in the first quarter after exit
- Percent of students who attain a GED, high school diploma, or
certificate by the end of the third quarter after exit
Baselines: (PY 2005) Placement and
diploma/equivalent rates
Targets: Establish baselines
|
Goals with changes in the wording or targets are
identified by the endnote 1. New goals are identified by the endnote
2.
|
Performance Goal DOL-05-1.1B: Improve educational
achievements of Job Corps students, and increase participation of Job Corps
graduates in employment and education (ETA\ PY 2005)1
|
|
Indicators:
- The percent of Job Corps graduates (within 1 year of program
exit) and former enrollees (within 90 days of program exit) who will enter
employment or enroll in post-secondary education or advanced
training/occupational skills training
Baseline: (PY 2004) 84%
Target: 85%
- The percent of students who will attain a GED, high school
diploma or certificate while enrolled in the program
Baseline: (PY 2004) 64%
Target: 64%
- Percent of students who achieve literacy or numeracy gains of
one or more Adult Basic Education (ABE) levels
Baseline: (PY 2004) 47%
Target: 45% |
Goals with changes in the wording or targets are
identified by the endnote 1. New goals are identified by the endnote
2.
|
Performance Goal DOL-05-1.1C: Improve the employment
outcomes for veterans who receive One Stop Career Center services and
veterans’ program services (VETS\PY 2005)1 |
|
Indicators:
- Veterans: Percent of Veteran job seekers employed in the first
or second quarter following registration.
Baseline: (PY 2003) 58%
Target: 59%
- Veterans: Percent of Veteran job seekers still employed two
quarters after initial entry into employment with a new employer.
Baseline: (PY 2003) 79%
Target: 81%
- Disabled veterans: Percent of Disabled Veteran job seekers
employed in the first or second quarter following registration.
Baseline: (PY 2003) 53%
Target: 55%
- Disabled veterans: Percent of Disabled Veteran job seekers
still employed two quarters after initial entry into employment with a new
employer.
Baseline: (PY 2003) 77%
Target: 79%
- Homeless veterans: Entered employment rate for homeless
veterans participating in the Homeless Veterans' Reintegration Program
(HVRP)
Baseline: (PY 2003) 61%
Target: 61%
- Homeless veterans: Employment retention rate after 6 months for
homeless veteran HVRP participants.
Baseline: (PY 2004)* 58%
Target: 58%
*Based on three quarters' data. |
Goals with changes in the wording or targets are
identified by the endnote 1. New goals are identified by the endnote
2.
|
Performance Goal DOL-06-1.1A: Strengthen the registered
apprenticeship system to meet the training needs of business and workers in the
21st Century (ETA)1 |
|
Indicators**:
- Retention: Percent of those employed nine months after
registration as an apprentice
Baseline: (FY 2005) 78%
Target: 78%
- Earnings increase: Average hourly wage gain for tracked
entrants** employed in the first quarter after registration and still employed
nine months later.
Baseline: (FY 2005) $1.26
Target: $1.26
* Because apprentices are employed by definition, no entered
employment measure is proposed for apprenticeship programs.
**23 states are federally-registered apprenticeship programs and
enter data on individuals into the Registered Apprenticeship Information System
(RAIS). A group of "tracked entrants" is defined as the cohort of apprentices
registered and entered into RAIS during a given reporting period. |
Goals with changes in the wording or targets are
identified by the endnote 1. New goals are identified by the endnote
2.
|
Performance Goal DOL-06-1.1B: Advance knowledge and inform
disability employment policy that affects systems change throughout the
workforce development system. (ODEP-FY06)2 |
|
Indicators:
- Number of policy related documents disseminated
Baseline: FY 2006
Target: TBD
- Number of formal agreements initiated
Baseline: FY 2006
Target: TBD
- Number of effective practices identified
Baseline: (FY 2004) 10
Target: 21 |
Goals with changes in the wording or targets are
identified by the endnote 1. New goals are identified by the endnote
2.
Outcome Goal 1.2 — Improve the effectiveness
of information and analysis on the U.S. economy
|
Performance Goal DOL-06-1.2A: Improve information
available to decision-makers on labor market conditions, and price and
productivity changes (BLS)2 |
|
Performance Measures
|
Performance Targets |
|
|
'04 |
'05 |
'06 |
|
The percent of output, timeliness, accuracy, and long-term
improvement targets achieved for labor force statistics.a/2 |
89% |
85% |
85% |
|
The percent of output, timeliness, accuracy, and long-term
improvement targets achieved for prices and living
conditions.a/2 |
93% |
85% |
85% |
|
The percent of output, timeliness, accuracy, and long-term
improvement targets achieved for compensation and working
conditions.a/2 |
86% |
85% |
85% |
|
The percent of output, timeliness, accuracy, and long-term
improvement targets achieved for productivity and
technology.a/2 |
100% |
85% |
85% |
|
Enhance efficiency and effectiveness |
|
|
|
|
Cost per transaction of the Internet Data Collection
Facility |
$6.13 |
$3.32 |
$2.58 |
|
Raise customer satisfaction with BLS products and services (e.g.,
the American Customer Satisfaction Index) [2001 baseline =
74%]b / 2 |
82% |
75% |
75% |
aThe BLS revised its performance measures in
its 2007 budget submission. Results for 2004 and estimates for 2005 are shown
for comparative purposes only.
bThe BLS measures users'
satisfaction with the Occupational Outlook Handbook website.
Goals with changes in the wording or targets are
identified by the endnote 1. New goals are identified by the endnote
2.
Goal 2 — A Secure Workforce: Promote the
economic security of workers and families
Outcome Goal 2.1 — Increase compliance with
worker protection laws
|
Performance Goal DOL-06-2.1A: American workplaces legally
employ and compensate workers (ESA)2 |
|
Indicators: Covered American workplaces legally,
fairly, and safely employ and compensate their workers by:
- Number of workers for whom there is an agreement to pay or an
agreement to remedy per 1,000 enforcement hours
Baseline: FY 2006
Target: TBD
- Percent of prior violators who achieved and maintained Fair
Labor Standards Act (FLSA) compliance following a full FLSA investigation
Baseline: (FY 2004) 71%
Target: 73%
- Percent of low-wage workers across identified low-wage
industries paid and employed in compliance with FLSA
Baseline: FY 2006
Target: TBD
- Number of wage determination data submission forms processed
per 1,000 hours
Baseline: 1,491
Target: 1,684
- Percent of survey-based DBA wage determinations issued within
60 days of the receipt of the underlying survey data
Baseline: (FY 2002) 100%
Target: 82% |
Goals with changes in the wording or targets are
identified by the endnote 1. New goals are identified by the endnote
2.
|
Performance Goal DOL-06-2.1B: Ensure union financial
integrity, democracy, and transparency (ESA) |
|
Indicators:
- Union financial integrity: Percent of unions with fraud
Baseline: (FY 2004) 9%
Target: 8%
- Union democracy: Percent of unions complying with standards for
democratic union officer elections
Baseline: FY 2006
Target: TBD
- Union transparency. Percent of union reports meeting standards
of acceptability for public disclosure.
Baseline: 73%
Target: 96% |
Goals with changes in the wording or targets are
identified by the endnote 1. New goals are identified by the endnote
2.
Outcome Goal 2.2 — Protect worker
benefits
|
Performance Goal DOL-06-2.2A: Make timely and accurate
benefit payments to unemployed workers, facilitate the reemployment of
Unemployment Insurance claimants, and set up Unemployment tax accounts promptly
for new employers (ETA)2 |
|
Indicators:
- Payment Timeliness: Percent of intrastate first payments made
within 21 days*
Baseline: (FY 2001) 89.1%
Target: 89.9%1
- Detect Overpayments: Establish for recovery a percent of the
amount of estimated overpayments that States can detect and recover.
Baseline: (FY2002) 57.9%
Target: 59.5%1
- Facilitate Claimant Reemployment: Percent of UI claimants who
were reemployed by the end of the first quarter after the quarter in which they
received their first payment
Baseline: FY 2006
Target: TBD
- Establish Tax Accounts Promptly: Percent of new employer
liability determinations made within 90 days of the end of the first quarter in
which they become liable.
Baseline: (FY 2001) 79.1%
Target: 82.5%1 |
Goals with changes in the wording or targets are
identified by the endnote 1. New goals are identified by the endnote
2.
|
Performance Goal DOL-06-2.2B: Minimize the impact of
work-related injuries (ESA)2 |
|
Indicators:
- For FECA cases of the United States Postal Service, achieve a
lost production days (LPD) rate (LPD per 100 employees) of 146 days.
Baseline: (FY 2003) 147.6 days
Target: 146 days
- For FECA cases of All Other Government Agencies, achieve a lost
production days rate (LPD per 100 employees) of 60 days.
Baseline: (FY 2003) 56 days
Target: 60 days
- Through staff-initiated evaluation of cases under Periodic Roll
Management for changes in medical condition and fitness for duty, produce $13
million in savings in FY 2006
Baseline: NA
Target: $13m
- The trend in the indexed cost per case of FECA cases receiving
medical treatment will remain below the comparable measure for nationwide
health care costs.
Baseline: Milliman U.S.A. Health
Costs Index
Target: Remain below Milliman HCI
- Achieve targets for five communications performance areas.
Targets: Meet at least four of the
five following targets:
Use of FECA program electronic services —
2.838 million contacts
Average Caller wait times — 3.0 minutes
Average
time to return calls — 2.5 days
Calls resolved on the first try —
67%
Calls handled according to program quality standards — 95%
- Reduce the average time required to resolve disputed issues in
Longshore and Harbor Worker's Compensation Program contested cases
Baseline: (FY 2005) 253 days
Target: 250 days
- Percent of Black Lung Benefit claims filed under the revised
regulations for which, following an eligibility decision, there are no requests
for further action from any party pending one year after receipt of the claim.
Baseline: (FY 2001) 66.5%
Target: 79.5%
- Increase initial claims for benefits in the Part B Energy
Program that are processed within standard timeframes.
Baseline: FY 2006
Target: 50%
- Increase the percent of Final Decisions in the Part B Energy
Program that are processed within standard timeframes.
Baseline: 75%
Target: 80%
- Percent of EEOICPA Part E claims backlog receiving recommended
decisions
Baseline: FY 2006
Target: 75% |
Goals with changes in the wording or targets are
identified by the endnote 1. New goals are identified by the endnote
2.
|
Performance Goal DOL-06-2.2C: Secure pension, health and
welfare benefits (EBSA) |
|
Enhance Pension and Health Benefits Security
Indicators:
- Enforcement: Ratio of closed civil cases with corrected
violations to civil cases closed
Baseline: (FY 1999-2001 Average)
46.04%
Target: 69%
- Ratio of criminal cases referred for prosecution to total
criminal cases
Baseline: (FY 1999-2001 Average)
23.45%
Target: 40.2%
- Participant Assistance: Customer Satisfaction Index for
Participants and Beneficiaries who have contacted EBSA for assistance
Baseline: (FY 2003) 59
Target: 65
- Applications to Voluntary Compliance programs
Baseline: (FY 2001-2003 average)
7,564
Target: 13,500 |
Goals with changes in the wording or targets are
identified by the endnote 1. New goals are identified by the endnote
2.
|
Performance Goal DOL-06-2.2D: Improve pension insurance
program (PBGC) |
|
Indicators:
- Pension Practitioner Service: Customer Satisfaction score for
practitioner callers
Baseline: (FY 2002) 69
Target: 74
- Participant Service: Customer Satisfaction score for responding
to trusteed plan participants' inquires
Baseline: (FY 2001) 73
Target: 80 |
Goals with changes in the wording or targets are
identified by the endnote 1. New goals are identified by the endnote
2.
Goal 3 — Quality Workplaces: Foster
Quality Workplaces that are safe, healthy and fair
Outcome Goal 3.1 — Reduce workplace
injuries, illnesses, and fatalities
|
Performance Goal DOL-06-3.1A: Reduce work-related
fatalities and injuries (MSHA)1 |
|
Indicators:
- Fatal injury incidence rate — fatalities per 200,000 hours
worked
Baseline: (FY 2003) 0.0229
Target: (FY 2006) 0.0208
- All-injury incidence rate — injuries per 200,000 hours
worked
Baseline: (FY 2000) 5.07
Target: (FY 2006) 3.13 |
Goals with changes in the wording or targets are
identified by the endnote 1. New goals are identified by the endnote
2.
|
Performance Goal DOL-06-3.1B: Reduce mining-related
illnesses (MSHA)1 |
|
Indicators:
- Percent of respirable coal mine dust samples exceeding the
applicable standard (for designated occupations).
Baseline: (FY 2003/2004) 10.6%
Target: 9.5%
- Improve respirable silica dust sampling effectiveness by
identifying occupations with overexposures as measured by an increase in the
percent of silica dust samples taken with at least 50% of the permissible
exposure limits in metal and nonmetal mines
Baseline: (FY 2005) 16.3%
Target: 17.1%
- Improve noise sampling effectiveness by identifying occupations
with overexposures as measured by an increase in the percent of noise samples
with at least 50% of the permissible exposure limits taken in metal and
nonmetal mines
Baseline: (FY 2005) 20.9%
Target: 21.9%
- Percent of noise exposures above the citation level in coal
mines
Baseline: 5.3%
Target: 5.0% |
Goals with changes in the wording or targets are
identified by the endnote 1. New goals are identified by the endnote
2.
|
Performance Goal DOL-06-3.1C: Reduce work-related
fatalities (OSHA) |
|
Indicator: Reduce the rate of workplace
fatalities by 9 percent from baseline. (OSHA)
Baseline: (FY 2000-2002 average)
1.62 fatalities per 100,000 workers
Target: (FY 2004-2006
average) 1.47 fatalities per 100,000 workers |
Goals with changes in the wording or targets are
identified by the endnote 1. New goals are identified by the endnote
2.
|
Performance Goal DOL-06-3.1D: Reduce work-related injuries
and illnesses (OSHA) |
|
Indicator: Reduce the rate of workplace injuries
and illness by 12 percent from baseline. (OSHA)
Baseline: (CY 2002) 1.6 days away
from work cases per 100 workers
Target: (CY 2006) 1.4 days
away from work cases per 100 workers |
Goals with changes in the wording or targets are
identified by the endnote 1. New goals are identified by the endnote
2.
Outcome Goal 3.2 — Foster equal opportunity
workplaces
|
Performance Goal DOL-06-3.2A: Federal contractors achieve
equal opportunity workplaces (ESA)1 |
|
Indicator: Reduce the incidence of discrimination
among Federal contractors.
Baseline: (FY 2001) 12.5%
Target: 6%
Indicator: Increase compliance among Federal
contractors in all other aspects of equal opportunity workplace standards.
Baseline: (FY 2001) 57%
Target: 64% |
Goals with changes in the wording or targets are
identified by the endnote 1. New goals are identified by the endnote
2.
|
Performance Goal DOL-06-3.2B: Reduce employer-employee
employment issues originating from service members’ military obligations
conflicting with their civilian employment (VETS)1 |
|
Indicator: USERRA Progress Index (measures
compliance progress and assistance progress)
Compliance Progress: 1) Number of Guard/Reserve
de-mobilized per USERRA claim filed by Guard/Reserve; 2) Number of
Guard/Reserve de-mobilized per USERRA claim filed by Guard/Reserve in primary
issues; 3) Number of USERRA violations; 4) Number of USERRA violations in
primary issues; 5) Number of meritless USERRA claims; 6) Number of meritless
USERRA claims in primary issues; and 7) Average days cases remain in VETS
jurisdiction
Assistance Progress: Number of USERRA assistance contacts
per Guard/Reserve mobilized and de-mobilized
Baselines: (FY 2005) USERRA
Progress Index = 100%
Target: 105% |
Goals with changes in the wording or targets are
identified by the endnote 1. New goals are identified by the endnote
2.
Outcome Goal 3.3 — Reduce Exploitation of
Child Labor, Protect the Basic Rights of Workers, and Strengthen Labor Markets
|
Performance Goal DOL-06-3.3A: Contribute to the
Elimination of the Worst Forms of Child Labor Internationally
(ILAB) |
|
Indicators:
- Number of children prevented or withdrawn from exploitive child
labor provided education and/or training opportunities as a result of
DOL-funded child labor elimination projects
Baseline: (Prior 5-year average)
119,962
Target: 178,000
- Number of countries with increased capacity to address child
labor as a result of DOL-funded child labor elimination projects
Baseline: (Prior 5-year average)
22
Target: 39 |
Goals with changes in the wording or targets are
identified by the endnote 1. New goals are identified by the endnote
2.
|
Performance Goal DOL-06-3.3B: Improve living standards and
conditions of work internationally (ILAB) |
|
Indicators:
- Percent of USDOL project beneficiaries who consider a
USDOL-funded project to have improved their conditions of work
Baseline: (FY 2004) 62 percent
Target: 85 percent
- Increased compliance with national labor laws
Baseline: (FY 2005) 3.78
million
Target: 3.80 million
- Percent of targeted individuals whose economic situation has
benefited from USDOL project assistance
Baseline: (FY 2004) 39 percent
Target: 63 percent
- Increase in the number of targeted workers reporting a
reduction in HIV/AIDS risk behaviors.
Baseline: (FY 2005) 19,500
Target: 19,750
- Increase in the number of workplaces adopting policies and
procedures to reduce the level of employment related discrimination against
persons living with HIV/AIDS
Baseline: (FY 2005) 270
Target: 300 |
Goals with changes in the wording or targets are
identified by the endnote 1. New goals are identified by the endnote
2.
Goal 4 — A Competitive Workforce:
Maintain competitiveness in the 21st Century economy
|
Performance Goal DOL-05-4.1A: Increase employment,
retention and earnings of individuals registered under the Workforce Investment
Act Adult Program (ETA\PY 2005)1 |
|
Indicators:
- Entered Employment: Percent of participants employed in the
first quarter after program exit
Baseline: (PY 2003) 74%*
Target: 76%
- Retention: Percent of those employed in the first quarter after
program exit still employed in the second and third quarters after program exit
Baseline: (PY 2003) 85%*
Target: 81%
- Earnings increase: Average earnings gain for participants
employed in the first quarter after exit and still employed in the third
quarter after exit
Baseline: $3,260*
Target: $3,400
*Baseline data are based on slightly different measure
definitions. |
Goals with changes in the wording or targets are
identified by the endnote 1. New goals are identified by the endnote
2.
|
Performance Goal DOL-05-4.1B: Improve the outcomes for job
searchers and employers who receive One Stop employment and workforce
information services (ETA Program Year 2005)1 |
|
Indicators:
- Entered Employment: Percent of participants employed in the
first quarter after program exit
Baseline: (PY 2003) 61%*
Target: 61%
- Retention: Percent of those employed in the first quarter after
program exit still employed in the second and third quarters after program exit
Baseline: (PY 2003) 80%*
Target: 78%
- Earnings increase: Average earnings gain for participants
employed in the first quarter after exit and still employed in the third
quarter after exit
Baseline: PY 2005
Target: TBD
*Baseline data are based on slightly different measure
definitions. |
Goals with changes in the wording or targets are
identified by the endnote 1. New goals are identified by the endnote
2.
|
Performance Goal DOL-05-4.1C: Increase the employment,
retention, and earnings replacement of individuals registered under the
Workforce Investment Act Dislocated Worker Program (ETA\PY
2005)1 |
|
Indicators:
- Entered Employment: Percent of participants employed in the
first quarter after program exit
Baseline: (PY 2003) 82%*
Target: 83%
- Retention: Percent of those employed in the first quarter after
program exit still employed in the second and third quarters after program exit
Baseline: (PY 2003) 90%*
Target: 89%
- Earnings Increase: Average percent of pre-separation earnings
for participants employed in the first quarter after exit and still employed in
the third quarter after exit.
Baseline: (PY 2003) 91%*
Target: 92%
*Baseline data are based on slightly different measure
definitions. |
Goals with changes in the wording or targets are
identified by the endnote 1. New goals are identified by the endnote
2.
|
Performance Goal DOL-05-4.1D: Assist older workers to
participate in a demand-driven economy through the Senior Community Employment
Service Program (ETA\PY 2005)1 |
|
Indicators:
- Entered Employment: Percent of participants employed in the
first quarter after program exit
Baseline: (PY 2004) 36%
Target: 55%
- Retention: Rate of participants employed in the first quarter
after program exit still employed in the second and third quarters after
program exit
Baseline: PY 2004
Target: 65%
- Earnings increase: Average earnings gain for participants
employed in the first quarter after program exit and still employed in the
third quarter after program exit
Baseline: PY 2004
Target: To be established upon receipt of PY 2004
data |
Goals with changes in the wording or targets are
identified by the endnote 1. New goals are identified by the endnote
2.
|
Performance Goal DOL-05-4.1E: Increase accessibility of
workforce information through the National Electronic Tools (ETA\ PY
2005) |
|
Indicators:
- Increase number of page views on America's Career InfoNet
Baseline: PY 2005
Target: TBD
- Increase the dissemination of O*NET data measured by site
visits
Baseline: 2,767,655
Target: 3,874,717
- Increase the number of page views on Career Voyages
Baseline: PY 2005
Target: TBD |
Goals with changes in the wording or targets are
identified by the endnote 1. New goals are identified by the endnote
2.
|
Performance Goal DOL-06-4.1A: Address worker shortages
through the Foreign Labor Certification Program (ETA) |
|
Indicators:
- Percent of H-1B applications processed within seven days of the
filing date for which no prevailing wage issues are identified
Baseline: (FY 2004) 99%
Target: 100%
- Percent of employer applications for labor certification under
the streamlined system that are resolved within six months of filing
Baseline: (FY 2005) 57%
Target: 60%
- Percent of H-2B applications processed within 60 days of
receipt
Baseline: 70%
Target: 90%
- Percent of accepted H-2A applications processed within 15
business days (such that the determination date is no later than 30 days from
the date of need) where there are no pending State actions
Baseline: FY 2006
Target: 95% |
Goals with changes in the wording or targets are
identified by the endnote 1. New goals are identified by the endnote
2.
|
Performance Goal DOL-06-4.1B: Assist workers impacted by
international trade to better compete in the global economy through the Trade
Adjustment Assistance Program (ETA)1 |
|
Indicators:
- Entered Employment: Percent of participants employed in the
first quarter after program exit
Baseline: (FY 2001) 65%*
Target: 70%
- Percent of participants employed in the first quarter after
program exit still employed in the second and third quarters after program
exit
Baseline: (FY 2001) 90%*
Target: 85%
- Earnings increase: Average percent of pre-separation earnings
for participants employed in the first quarter after exit and still employed in
the third quarter after exit.
Baseline: (FY 2004) 74%*
Target: 80%
*Baseline data are based on slightly different measure
definitions. |
Goals with changes in the wording or targets are
identified by the endnote 1. New goals are identified by the endnote
2.
Outcome Goal 4.2 — Promote job flexibility
and minimize regulatory burden
|
Performance Goal DOL-06-4.2A: Maximize regulatory
flexibility and benefits and promote flexible workplace programs (ASP)
|
|
Indicators: Wage and hour, worker safety, pension
and health care regulations, to the greatest extent practicable, are
performance-based and provide maximum flexibility to employers in developing a
compliance approach.
- Review identified significant regulations and develop
revisions
Target: (FY 2006) Initiate
rulemaking for revisions as appropriate
New and current regulations maximize net benefits. Regulations
that impose greater societal costs than benefits are revised, consistent with
applicable governing statutes
- Regulations identified for revisions or withdrawals as
appropriate
Target: (FY 2006) Initiate
rulemaking as appropriate
- Best practices for, and models of, flexible workplace practices
are identified and publicized
Baseline: (FY 2004) Develop best
practices studies
Target: Best practices disseminated
- Best practices for, and models of, flexible workplace practices
are identified and publicized
Baseline: (FY 2004) Develop best
practices studies
Target: Best practices disseminated |
Goals with changes in the wording or targets are
identified by the endnote 1. New goals are identified by the endnote
2.
This Appendix shows the Department of Labor Program Year 2006 goals.
These goals cover the period from July 1, 2006-June 30, 2007, and will
be reported in the FY 2007 Performance and Accountability Report.
|
Performance Goal DOL-06-1.1A: Improve educational
achievements of Job Corps students, and increase participation of Job Corps
graduates in employment and education (ETA\ PY 2006)1
|
|
Indicators:
- Percent of Job Corps participants entering employment or
enrolling in post secondary education and/or advanced training/occupational
skills training in the first quarter after exit
Baseline: (PY 2004) 84%
Target: 87%
- Percent of students who attain a GED, high school diploma, or
certificate by the end of the third quarter after exit
Baseline: (PY 2004) 64%
Target: 65%
- Percent students who achieve literacy or numeracy gains of one
or more Adult Basic Education (ABE) level
Baseline: (PY 2004)
47%
Target: 47% |
Goals with changes in the wording or targets are
identified by the endnote 1. New goals are identified by the endnote
2.
|
Performance Goal DOL-06-1.1B: Increase placements and
educational attainments for youth served through the WIA youth program
(ETA\PY2006)1 |
|
Indicators:
- Percent of youth who are in employment or the military or
enrolled in post secondary education and/or advanced training/occupational
skills training in the first quarter after exit
- Percent of students who attain a GED, high school diploma, or
certificate by the end of the third quarter after exit
- Literacy and numeracy gains: percentage of participants who
increase one or more educational functioning levels.
Baselines: (PY 2005) Placement and
diploma/equivalent rates; (PY 2006) literacy/numeracy
Targets: TBD — Placement and diploma/equivalent
rates;
Establish baseline for literacy/numeracy measure |
Goals with changes in the wording or targets are
identified by the endnote 1. New goals are identified by the endnote
2.
|
Performance Goal DOL-06-1.1C: Assist ex-offenders in
successful reintegration into the community and in remaining crime-free
citizens through preparation for and placement into the workforce (ETA\ PY
2006)2 |
|
Indicators: The program will use common measures
of entered employment, retention, earnings, and cost per (efficiency), as well
as a measure of recidivism, yet to be determined
- Entered employment: Percent of participants who are unemployed
at the time of registration who are employed in the first quarter after program
exit
- Retention: Percent of participants employed in the first
quarter after program exit who are still employed in both the second and third
quarters after program exit
- Earnings: Average earnings in the second and third quarter
after exit
- Recidivism: Recidivism rate for participants
Baseline: PY 2005-PY 2006
Targets: TBD |
Goals with changes in the wording or targets are
identified by the endnote 1. New goals are identified by the endnote
2.
|
Performance Goal DOL-06-1.1D: Increase employment
opportunities and improve the educational achievement of youth participating in
the Youthbuild program1 (ETA\ PY 2006) |
|
Indicators:
- Percent of youth who are in employment or the military or
enrolled in post secondary education and/or advanced training/occupational
skills training in the first quarter after exit
- Percent of students who attain a GED, high school diploma, or
certificate by the end of the third quarter after exit
- Percent of basic-skills-deficient students who achieve literacy
or numeracy gains of one or more Adult Basic Education (ABE) level
Baseline: PY 2006 for placement and
degree attainment measures;
PY 2006-2007 for the literacy/numeracy
Targets: TBD |
Goals with changes in the wording or targets are
identified by the endnote 1. New goals are identified by the endnote
2.
|
Performance Goal DOL-06-1.1E: Improve the employment
outcomes for veterans who receive One Stop Career Center services and
veterans’ program services (VETS\PY 2006)1 |
|
Indicators:
- Veterans: Percent of Veteran job seekers employed in the first
or second quarter following registration
Baseline: (PY 2003)
58%
Target: 59.5%
- Veterans: Percent of Veteran job seekers still employed two
quarters after initial entry into employment with a new employer
Baseline: (PY 2003)
79%
Target: 81.5%
- Disabled veterans: Percent of Disabled Veteran job seekers
employed in the first or second quarter following registration
Baseline: (PY 2003)
53%
Target: 55.5%
- Disabled veterans: Percent of Disabled Veteran job seekers
still employed two quarters after initial entry into employment with a new
employer
Baseline: (PY 2003 estimate) 77%
Target: 79.5%
- Homeless veterans: Entered employment rate for homeless
veterans participating in the Homeless Veterans' Reintegration Program
(HVRP)
Baseline: (PY 2003) 61%
Target: 61.5%
- Homeless veterans: Employment retention rate after 6 months for
homeless veteran HVRP participants
Baseline: (PY 2004)*
58%
Target: 58.5%
*Based on three quarters' data. |
Goals with changes in the wording or targets are
identified by the endnote 1. New goals are identified by the endnote
2.
|
Performance Goal DOL-06-4.1A: Increase the employment,
retention, and earnings replacement of individuals registered under the
Workforce Investment Act Dislocated Worker Program (ETA\PY 2006)1
|
|
Indicators:
- Entered Employment: Percent of participants employed in the
first quarter after program exit
Baseline: (PY 2003) 82%*
Target: 84%
- Retention: Percent of those employed in the first quarter after
program exit still employed in the second and third quarters after program exit
Baseline: (PY 2003)
90%*
Target: 90%
- Earnings: Average earnings in the second and third quarter
after exit*
Baseline: PY 2005
Target: TBD
*Measure changes in 2006 from earnings change to average earnings
and a new baseline will be established |
|
Performance Goal DOL-06-4.1B: Improve the
outcomes for job searchers and employers who receive One Stop employment and
workforce information services (ETA\ PY 2006)1 |
|
Indicators:
- Entered Employment: Percent of participants employed in the
first quarter after program exit
Baseline: (PY 2003)
61%*
Target: 63%
- Retention: Percent of those employed in the first quarter after
program exit still employed in the second and third quarters after program exit
Baseline: (PY 2003)
80%*
Target: 80%
- Earnings: Average earnings in the second and third quarter
after exit*
Baseline: PY
2005
Target: TBD
*Baseline data are based on slightly different measure
definitions. |
Goals with changes in the wording or targets are
identified by the endnote 1. New goals are identified by the endnote
2.
|
Performance Goal DOL-06-4.1C: Increase employment,
retention and earnings of individuals registered under the Workforce Investment
Act Adult Program (ETA\PY 2006)1 |
|
Indicators:
- Entered Employment: Percent of participants employed in the
first quarter after program exit
Baseline: (PY 2003)
74%*
Target: 76%
- Retention: Percent of those employed in the first quarter after
program exit still employed in the second and third quarters after program exit
Baseline: (PY 2003)
85%*
Target: 82%
- Earnings: Average earnings in the second and third quarter
after exit*
Baseline: PY 2005
Target: TBD
*Measure changes in 2006 so a new baseline will be established
using PY 2005 data |
Goals with changes in the wording or targets are
identified by the endnote 1. New goals are identified by the endnote
2.
|
Performance Goal DOL-06-4.1D: Assist older workers to
participate in a demand-driven economy through the Senior Community Employment
Service Program (ETA\ PY 2006)1 |
|
Indicators:
- Entered Employment Rate: Percent of participants employed in
the first quarter after program exit
Baseline: (PY 2004)
36%
Target: 56%
- Retention Rate: Percent of participants still employed in the
second and third quarters after program exit
Baseline: PY
2004
Target: 66%
- Earnings: Average earnings in the second and third quarter
after exit*
Baseline: PY
2004
Target: To be established upon receipt of PY 2004
data
* Measure changes in 2006 so a new baseline will be established
using PY 2004 data |
Goals with changes in the wording or targets are
identified by the endnote 1. New goals are identified by the endnote
2.
|
Performance Goal DOL-06-4.1E: Build a demand-driven
workforce system through Community Based Job Training Grants (ETA\ PY
2006)1 |
|
Indicators: The Community College
Initiative/Community Based Job Training Grants will be funded for the first
time in PY 2005, as authorized and appropriated through the FY 2005 Omnibus
Appropriations Act. Baseline data will be collected over PY 2006 and PY
2007.
- Entered Employment: Percent of participants employed in the
first quarter after program exit
- Retention: Percent of participants employed in the first
quarter after program exit still employed in both the second and third quarters
after program exit
- Earnings: Average earnings in the second and third quarter
after exit
Baselines: PY 2006 and 2007
Target: TBD |
Goals with changes in the wording or targets are
identified by the endnote 1. New goals are identified by the endnote
2.
|
Performance Goal DOL-06-4.1F: Increase accessibility of
workforce information through National Electronic Tools (ETA\ PY 2006)
|
|
Indicators:
- Increase number of page views on America's Career InfoNet
Baseline: PY
2005
Target: Increase by 1% over baseline
- Increase the dissemination of O*NET data measured by site
visits
Baseline: (PY 2003)
2,767,655
Target: 4,013,100
- Increase the number of page views on Career Voyages
Baseline: PY
2005
Target: 5% over baseline |
Goals with changes in the wording or targets are
identified by the endnote 1. New goals are identified by the endnote
2.
|