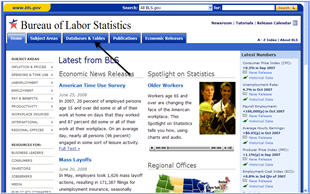
Create Customized Tables-Multi Screen TutorialThis tutorial will help you use the multiple screen version of the Create Customized Tables data tool. If your system disables Java applets, you should use this tool, instead of the one screen version to get historical data. Start by clicking on the Databases & Tables tab
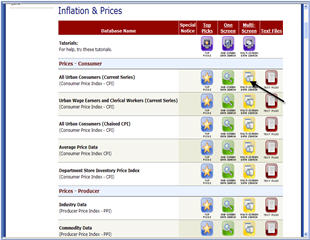
Scroll down to the Inflation & Prices section and click on the "All Urban Consumers (Current Series)" Multi Screen icon.
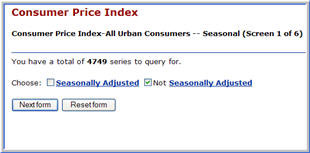
This first screen asks you to choose seasonally or not seasonally adjusted data. If you are looking for regional or local numbers, or are looking at historical data more than six months old, choose not seasonally adjusted data. Click on the "Next form" button.
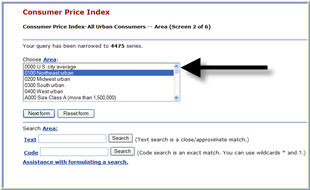
Next, select an area. You may scroll down within the box, or use the area search box to find your area. When you have highlighted your area, for example "Northeast urban", click on the "Next form" button.
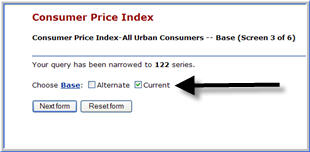
Unless you want the old reference base, 1967 is equal to 100, All Items indexes, always choose "Current" base on this screen. Click on the "Next form" button.
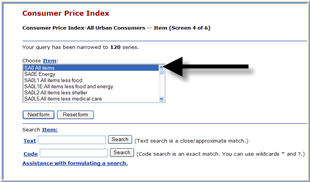
On this screen, choose the index item. Only items available for your area choice (Northeast urban, in this case) will display. You may also search for an item, then click "Next form".
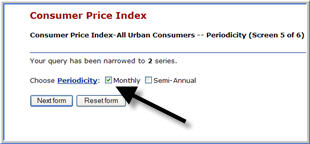
On this screen, you can choose between --monthly or bimonthly--records and semi-annual records. We will use monthly. Click on the "Next form" button.
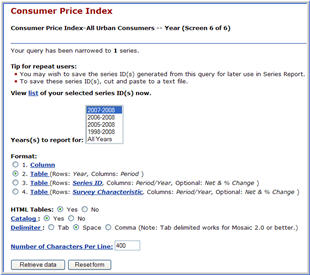
Finally, select the number of years of data you want to extract and the output formats, to see if you wish to change them from the default settings. We will use the defaults. Click on the "Retrieve data" button.
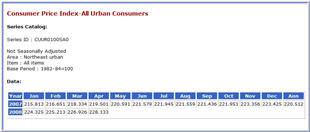
A table displays index numbers for the selected years.
This concludes the tutorial. Thank you for visiting the Bureau of Labor Statistics' website. |
Tools |
Calculators |
Help |
Info |