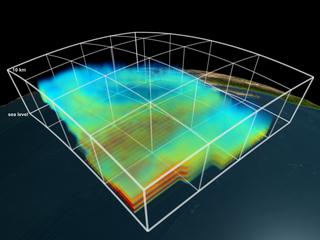
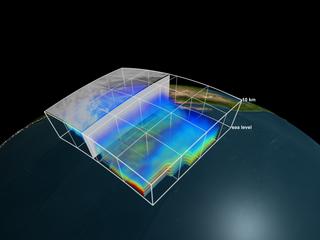
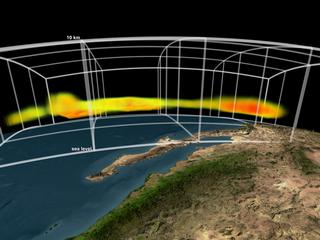
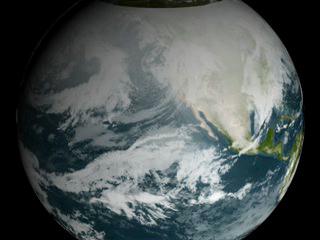
This visualization shows 3D volumetric water vapor data from the Aqua/Atmospheric Infrared Sounder (AIRS) instrument. As the camera moved down and around the data set, the low data values are faded out revealing only the highest concentrations of water vapor data.
This version (#2) ends with a slightly lower threshold than the original version - showing more of the highest water vapor concentrations.
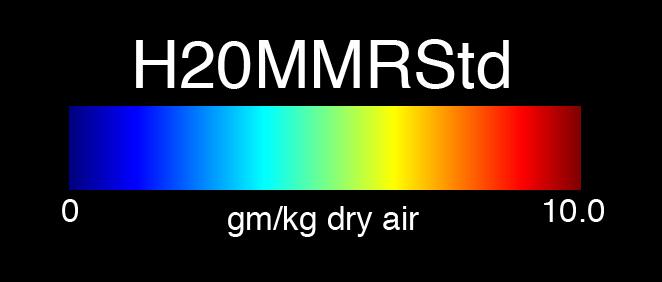
The color and opacity at each 3D voxel are driven by the water vapor data. The data set was obtained by Aqua on January 1, 2003. Only data from the sea level to about 10km are shown.
This visualization was created to support a JPL press release about how assimilated AIRS data is improving global atmospheric simulation model forecasts by about 6 hours (from about 5 days to about 5 days and 6 hours).


