|
Not long ago, a normal cell was like a molecular black box. In 1971, when Congress declared War on Cancer, scientists knew the major parts and functions of a cell, but they did not understand what was happening at the molecular level. Some fundamental questions about what makes a normal cell change into a cancer cell remained unanswered.
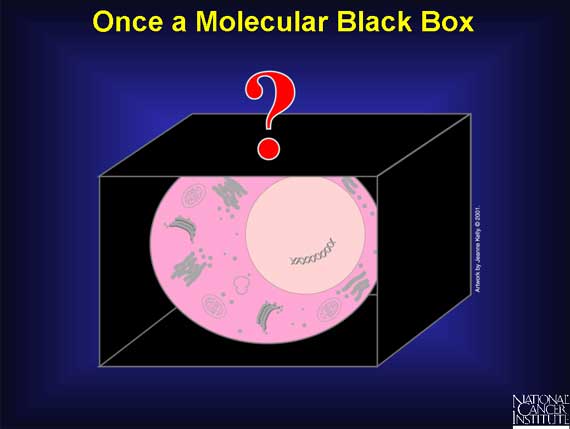
Using exciting, new advances in the technology of molecular biology, scientists have opened the molecular black box and are making discoveries today that were unthinkable just a generation ago.

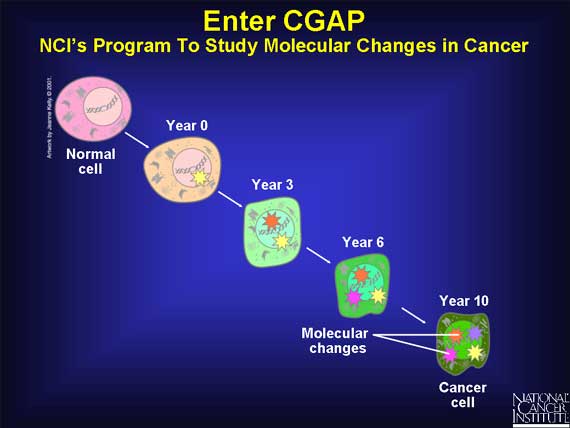
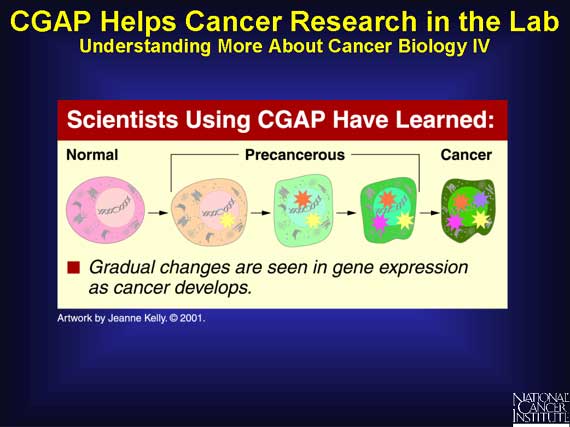
Scientists know that cancer arises when a cell undergoes several molecular
changes. These changes take place over many years, and only when the cell has
accumulated a critical number of these changes does it become a "cancer" cell.
In 1996, the Cancer Genome Anatomy Project (CGAP) began. This program of the
National Cancer Institute (NCI) is studying the molecular changes that occur
when a normal cell is transformed into a cancer cell.
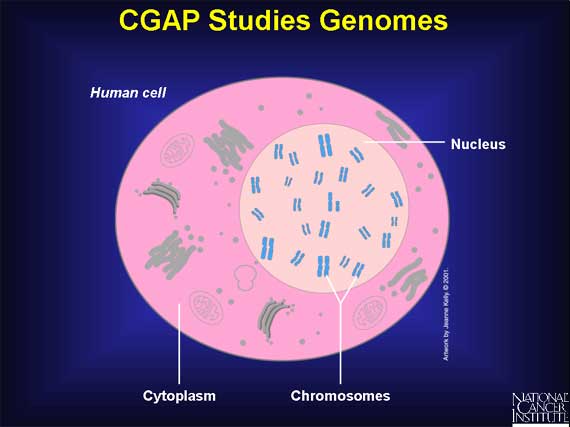
CGAP studies the molecular changes in genomes. A genome can simply be thought of
as the complete set of instructions for making an organism. Each organism has
its own unique genome. In a human cell, the genome is found in the nucleus. A
human genome has 22 pairs of chromosomes and a pair of sex chromosomes.
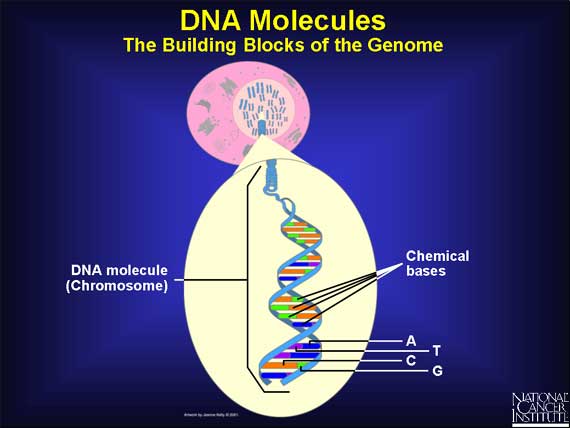
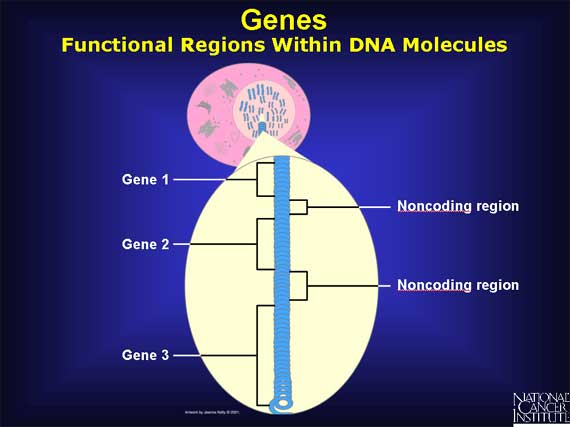
A genome is made up of DNA molecules that contain only four chemical bases: Adenine, Thymine, Cytosine, and Guanine--called A, T, G, and C, for short. Each DNA molecule, also known as a chromosome, is made up of two related strands. Since A only likes to match up with T, and C only with G, the order on one strand dictates the order on the other. This is called base pairing and enables the genome to make copies of itself.
The order of the bases spells out a code that will be used to make the organism.
Genes are functional regions within the DNA molecules, and their mission is to code the instructions to make specific proteins. The human genome is thought to have approximately 25,000 genes spread across all 23 pairs of human chromosomes.
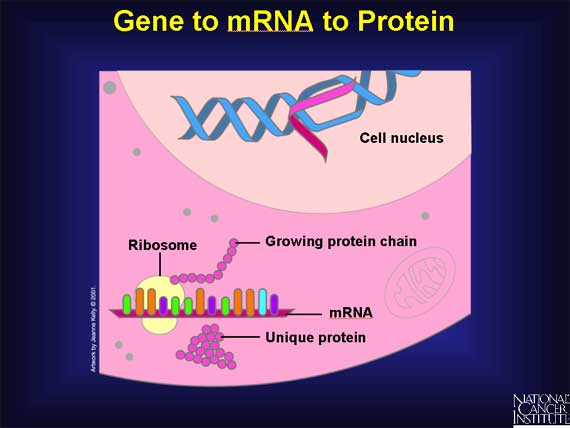
When a gene "switches on," it eventually makes a protein, but it does not do so directly. First the gene codes an intermediary molecule called mRNA. To transfer a gene's information from DNA to mRNA, base pairing is used. However, there is one change: an adenine base (A) in the DNA matches with a new base called uracil (U) in the mRNA. This difference helps to distinguish mRNA from DNA.

mRNA travels from the nucleus into the cytoplasm to cell organelles called ribosomes. There it directs the assembly of amino acids that fold into a unique protein.
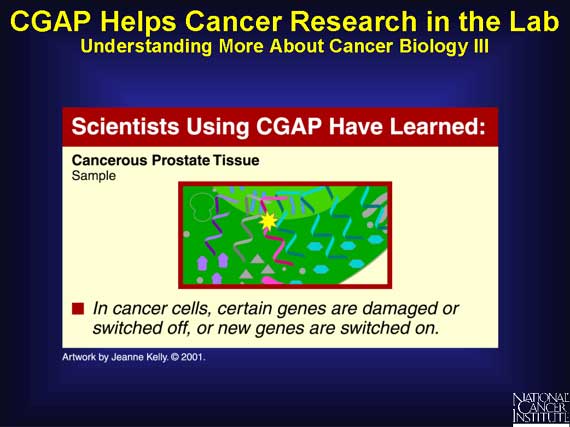
In normal tissues, the genes have no design problems, but in cancer, changes occur in the DNA. Some of the genes, and hence the proteins, are not made correctly. For example, a protein may be missing, overproduced, shortened, or assembled with alterations.
Such alterations can eventually contribute to uncontrolled growth and cancer.

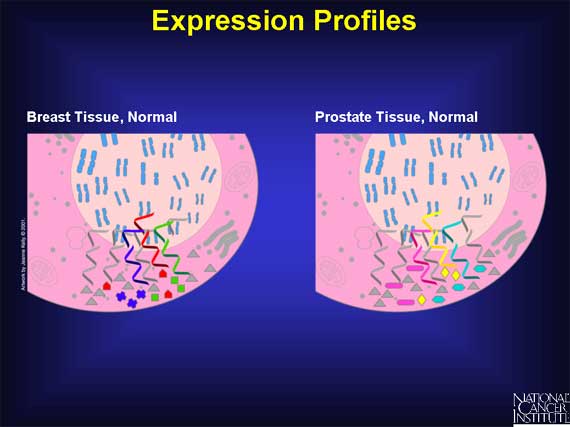
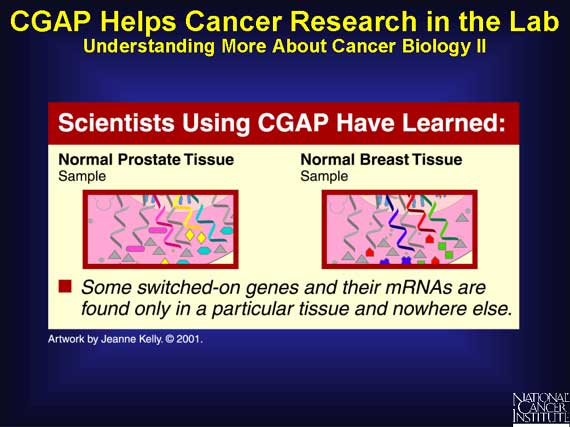
In any type of tissue, only a limited set of the genes are switched on at any
given time. Also, from one tissue type to another, the limited set of genes
involved will vary. Thus, each tissue can be identified by its unique pattern
of gene expression. This pattern is often called an "expression profile" or a
"molecular signature".
Here is an example of a normal breast cell and a normal prostate cell. Although
both of these cells have many mRNAs and proteins in common (grey), they also
have unique differences.
It is possible to measure differences between a normal and a cancer tissue of the same type--for example, normal and cancerous prostate. Samples of normal prostate tissue will have identical expression profiles. But when a normal prostate tissue is transformed into cancerous prostate tissue, the expression profile changes.
Any changes in gene expression ultimately cause alterations in protein production. New expression profiles in a cancer cell can dramatically alter the network of proteins that interact. A critical protein may no longer be available, another may be overproduced, yet another may be flawed. And when new genes become activated, entirely new proteins may be introduced.
Many different combinations of gene changes and protein interactions are seen in cancerous tissue.

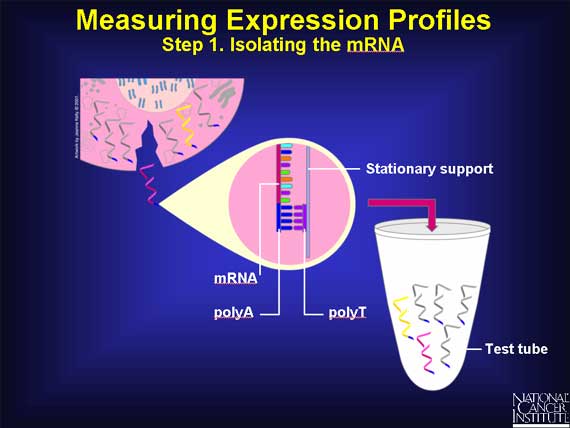
There are two different ways to capture expression profiles, by measuring either the mRNA or the protein molecules. CGAP measures the mRNA molecules.
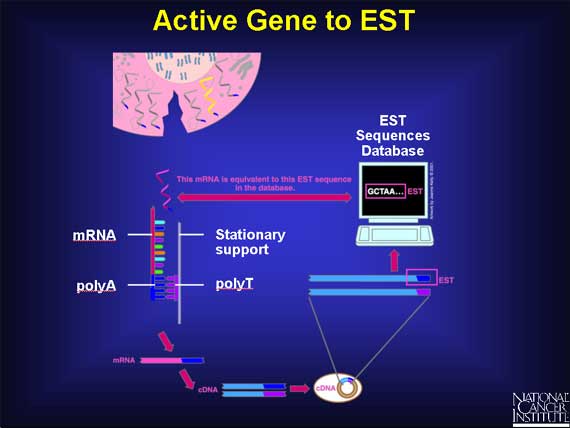
First, the mRNA molecules must be separated from all the other cellular molecules. Each mRNA has a unique label attached at one end, a short length of A bases (polyA) strung one after the other. Scientists take clever advantage of this feature. They create a stationary support holding short chains of polyT bases. As the cell's content passes over the support, the polyA ends of the mRNAs base pair with the chains of polyT. This isolates the mRNAs.
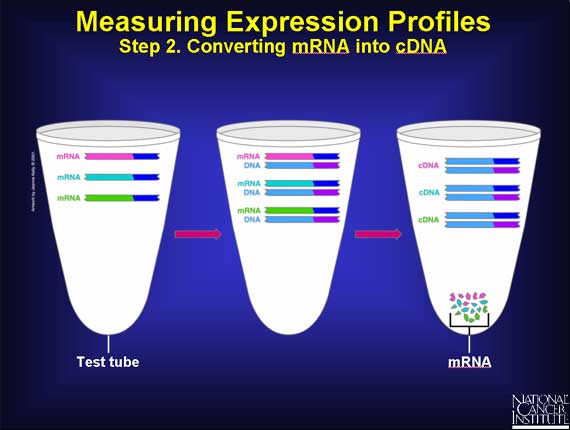
Unfortunately, the mRNA molecules are not very stable and may be present in very small amounts. So, having captured the mRNAs, scientists quickly convert them into something more stable and easily measured.
The next step is to convert the mRNA back into a DNA molecule in the test tube. This can be thought of simply as reversing what went on in the cell when the gene DNA was switched on and mRNA was made by base pairing.
This is a two-stage process. First, each mRNA is copied into a new DNA strand using base pairing to form a mRNA-DNA duplex. Next, the mRNA is chopped up and removed, and the DNA strand is used to make a second DNA strand. This double-stranded DNA is called complementary DNA or cDNA.
Thus, each cDNA in the test tube originally came from a specific mRNA in the cell.
At this stage there are lots of cDNA molecules in the test tube. The goal is to
count how many different types there are and how many of each type are present.
To do this, scientists use E. coli bacteria. Each bacterium contains a small
circular piece of DNA called a plasmid. Scientists are able to insert a single
cDNA molecule into each plasmid. This solution of E. coli, in which every
bacterium has one cDNA molecule per plasmid is called a "cDNA library".

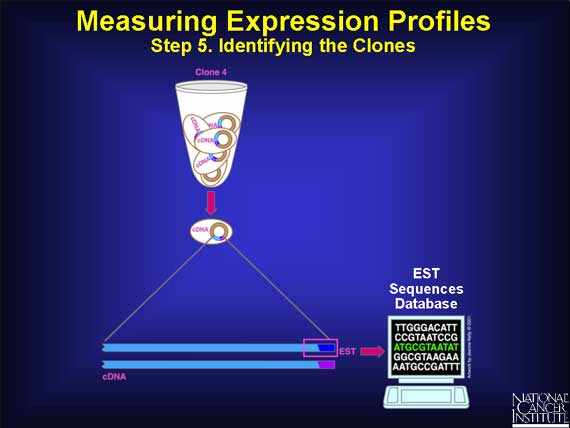
Each E. coli is isolated from the others and placed in a tiny test tube of its
own. It is allowed to divide many times, making identical copies of itself
and the inserted DNA. These identical copies are called "clones."

The final step in the process of capturing an expression profile is to identify the cDNA molecule in each clone. This is done by determining the order of, or sequencing, the bases in the cDNA. Fortunately, rather than sequence every base, scientists need only sequence about 400 bases at the polyA end to uniquely identify the entire cDNA. This short sequence is called an "expressed sequence tag" or EST, and its sequence information is stored in a public database for everyone to use.
In summary, the EST represents the switched-on gene and its mRNA that was originally present in the cell.
By measuring all the ESTs, scientists can tell which genes were switched on in the cells of the original tissue, either normal or cancerous.
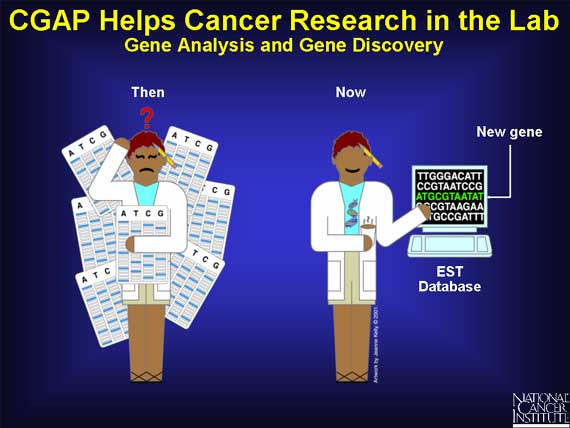
CGAP has become the largest contributor of sequences to the EST database, all of which are made available to the public at no cost. In addition, CGAP has developed valuable informatics tools that help researchers to analyze this vast amount of complex data.
Using the EST database and CGAP analysis tools, scientists can find information about a particular gene in a few moments, in contrast to a few years ago, when it would have taken many hours of tedious lab work. CGAP EST data also has allowed scientists to discover genes never before seen.
CGAP has helped scientists to discover much about normal and cancer cells and their differences in a very short time.

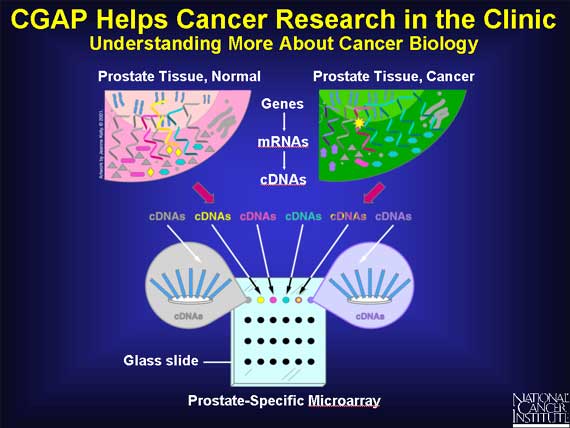
Researchers use cDNAs to build microarrays.
A microarray consists of a glass slide onto which a large variety of cDNAs are placed in separate spots. Each spot contains many copies of the same cDNA molecules.
Microarrays enable scientists to find which genes are switched on or off in a tissue. To make a prostate-specific microarray, for example, researchers select specific cDNAs from genes that are switched on in prostate tissue of all types: normal, precancerous, or cancerous.
Here is one simplified example in prostate tissue of how a normal cell might differ from a cancerous one.
In a very simplified case, two patients suspected of having prostate cancer enter the clinic.
The mRNAs from each patient's prostate cells are isolated, labeled with a fluorescent dye, and
allowed to base pair with the cDNAS on separate, yet identical, prostate-specific microarrays.

When an mRNA molecule finds a cDNA that shares the same gene of origin, base pairing occurs. The fluorescent dye attached to the mRNA allows the clinician to detect and measure this binding.
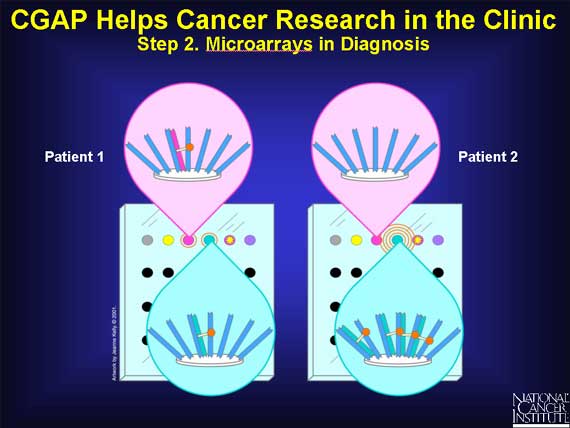
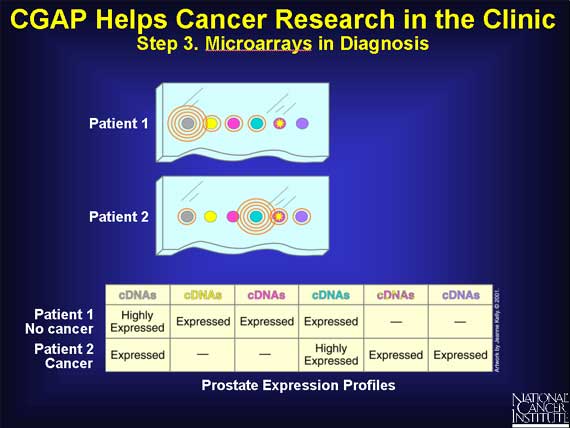
By looking at the pattern of "lit up" spots on the microarray, the clinician can see which genes were originally expressed in the patients' prostate cells and make a rapid and accurate diagnosis.
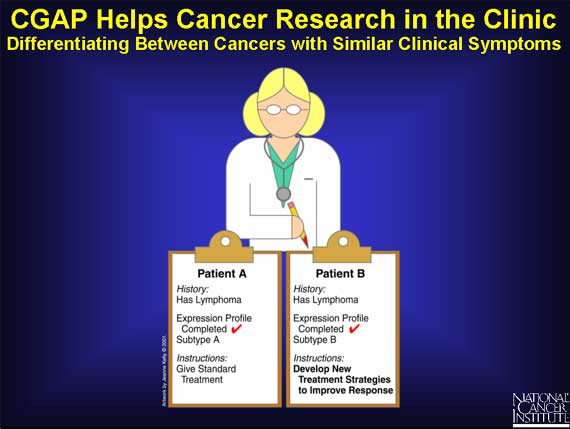
Microarrays have recently been used to discover that what appeared to be a single type of lymphoma was actually a mixture of two cancer subtypes at the molecular level. CGAP cancer researchers then discovered that only one subtype gave the best overall response. New treatment strategies must be developed to improve response for all subtypes of cancer.
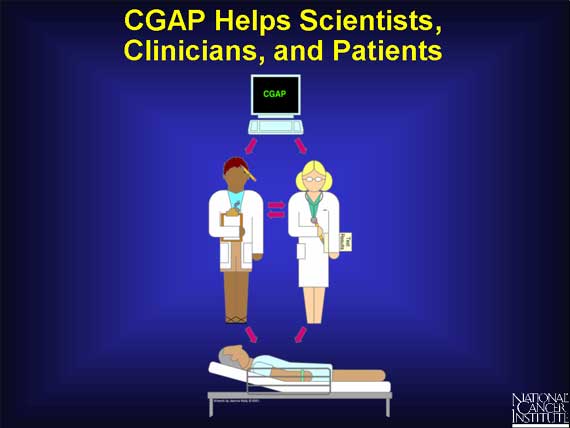
CGAP's use of new technologies has generated valuable information for cancer researchers worldwide, empowering the discovery of new genes and speeding up gene analysis.
These advances are providing new insights, helping clinicians to develop a molecular approach to cancer diagnosis and treatment.
The future holds great promise for cancer patients who are already beginning to benefit from these advances.
|