- Jump to...
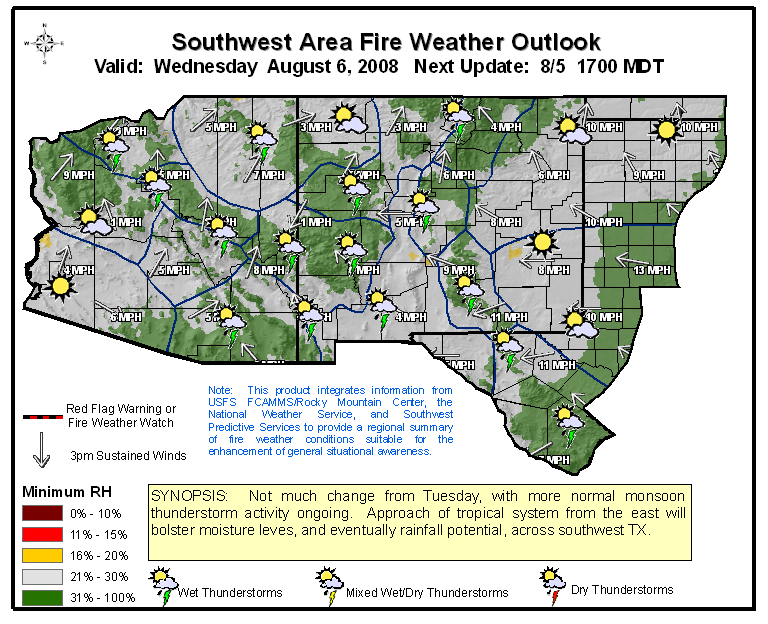
- Clickable Fire Weather Forecast Map

Click on a Name to view the site specific forecast or the Zone to view the zone forecast.
Site specific Forecasts are based on a 2.5 square kilometer grid box for which the RAWS/ASOS site is located. Elevations are an average for the 2.5 square kilometer grid box.
Fire Weather Products
Quick Links |
Fire Weather Forecasts |
Red Flag Warning & Fire Weather Watch |
Point Forecast Matrix |
Albuquerque |
El Paso |
|
Midland |
Lubbock |
Amarillo |
| |
Flagstaff |
Phoenix |
Tucson |
Note: Please check times on all products to make sure they are current. |
Weather
Activity Planner:
Fire Weather Program Information
Summary of NWS Fire Weather Service Areas,
Spot Forecasts
Albuquerque Spot Forecast Request and Monitoring Page
Latest Spot Forecast Issued by NWS Albuquerque
Fire Weather Outlooks

SPC Day 1 and Day 2 Fire Weather Outlooks - SPC
Day 1 | Day 2 Fire Behavior Outlooks - Southwest Coordination Center
7-Day Significant Fire Potential Outlook - Southwest Coordination Center
Weather Observations and Climate Outlooks
Drought and Precipitation Monitoring
Drought Monitor- Comprehensive site from the National Drought Mitigation Center.
New Mexico SNOTEL Sites - Daily measurements and percentages of normal of the snowpack in the high mountains of New Mexico and Colorado. The extent of the snowpack and how early in the spring it melts are factors in the length and severity of the fire season in New Mexico.
Weekly Regional Precipitation Analysis - Climate Prediction Center. Updated every Monday morning. (Note: This analysis is based on preliminary and unchecked data.)
Palmer Drought Index - Climate Prediction Center.
Crop Moisture Index - Climate Prediction Center.
Precipitation accumulation - 1,7,30 and 90 days from CPC
Fire Behavior, Danger and Fuels Information
Wildland Fire Situation Reports - Updated Daily
Wildland Fire Assessment System (WFAS) - National maps of selected fire weather and fire danger components of the National Fire Danger Rating System (NFDRS). Also has maps of Keetch-Byram and Palmer drought indices.
Fire Danger and Potential Graphics from WFAS - Updated Each Evening
Note: Forecasts may not depict accurate fire danger between October and April.
* The experimental fire potential index map uses satellite derived Relative Greenness, an NFDRS fuel model map (both 1 km resolution), and an interpolated 10-hour timelag map as inputs to weight the relative influence of live and dead vegetation to fire potential. The scale ranges from 0 (low) to 100 (high).
Dead Fuel Moisture - Updated Each Evening
Southwest Growing Season Index (WFAS-MAPS NIFC)
|

 National
Weather Service Weather Forecast Office
National
Weather Service Weather Forecast Office