
Hispanic Workers
As the U.S. labor force grows, the number and proportion of Hispanic workers increase. Hispanic workers accounted for 10.9% of the 135 million workers employed in 2001 (Tables 1–3 and 1–4). But BLS projects that by 2010, the Hispanic labor force will number 30.3 million—up from 22.4 million in 2000. This figure represents a 3.1% annual growth rate. In 2001, Hispanic workers exceeded 10.9% of those employed in four occupational groups (service occupations, 16.3%; precision production, craft, and repair, 14.7%; operators, fabricators, and laborers, 17.7%; and farming, forestry, and fishing, 21.5%) and in two industries (agriculture, 20.3%; and construction, 15.8%) (Tables 1–3 and 1–4). Limited data are available on occupational injury and disease risks among Hispanic workers.
During 1992–2002, BLS reported that the number of fatal injuries ranged from 533 to 895 among Hispanic workers. Rates varied from 5 to 6 per 100,000 employed (Figure 5–33). Most fatalities (4,239 or 55.2%) affect workers aged 25–44 (Figure 5–34) and occur among male workers (94%) (Figure 5–35). Work as operators, fabricators, and laborers accounted for the most fatalities (41.4% or 3,128 cases) (Figure 5–36). The largest proportion of fatal occupational injuries among Hispanic workers was in the construction industry (27.7% of the total, or 1,994 cases) (Figure 5–37). Transportation incidents accounted for 2,593 or 33.7% of fatal occupational injuries among Hispanic workers (Figure 5–38).
Cases of nonfatal occupational injury and illness with days away from work among Hispanic workers ranged from 198,022 in 1992 to 169,300 in 1996. When presented as a percentage of all nonfatal occupational injuries and illnesses with days away from work, the cases among Hispanic workers show a fairly consistent upward trend, from 8.5% in 1992 to 12.5% in 2001 (Figure 5–40). Hispanic workers had the highest median work loss (7 days) (Figure 5–41). Compared with white or black workers, Hispanic workers had the lowest percentages of short-term work loss (1 or 2 days) and the highest percentage of long-term work loss (31 days or more) (Figure 5–41). Among Hispanic workers, the distribution of nonfatal occupational injury and illness cases involving days away from work by occupation shows the highest proportion of cases (43.5% or 83,319 cases) among operators, fabricators, and laborers (Figure 5–42). Wholesale and retail trade and services accounted for the largest percentages of Hispanic cases (22.3% and 21.4%, respectively) (Figure 5–43).
Fatal Injuries
Magnitude and Trend
How were fatal occupational injuries distributed by race/ethnicity among Hispanic and non-Hispanic workers in 2002?
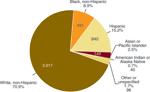 | Figure 5-32 Number and distribution of fatal occupational injuries by race/ethnicity among Hispanic and non-Hispanic workers, 2002. The 840 fatal occupational injuries among Hispanic workers (15.2% of the total) represented a 5.7% decrease from the 891 fatal occupational injuries reported in 2001. The 3,917 fatal injuries among white, non-Hispanic workers represented 70.9% of all fatal occupational injuries in 2002. (Source: BLS [2003a].) |
How did the number and rate of fatal injuries change among Hispanic workers during 1992–2002?
 | Figure 5-33 Number and rate of fatal occupational injuries among employed Hispanic workers, 1992-2002. During the 11-year period 1992-2002, the number of fatal occupational injuries among Hispanic workers ranged from 533 in 1992 to 895 in 2001. The fatal occupational injury rates varied from 5 to 6.0 per 100,000 employed workers during this 11-year period. (Note: BLS rounded rates to whole numbers for 1992-1995.) (Sources: BLS [2003a,d].) |
Age
How did fatal occupational injuries differ by age among Hispanic workers during 1992–2002?
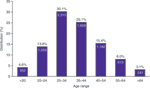 | Figure 5-34 Distribution and number of fatal occupational injuries among Hispanic workers by age, 1992-2002. During 1992-2002, workers aged 25-34 had the most fatal occupational injuries (2,310 or 30.1%), followed by workers aged 35-44 (1,929 or 25.1%). (Source: BLS [2003d].) |
Sex
How did fatal occupational injuries differ by sex among Hispanic workers during 1992–2002?
 | Figure 5-35 Number of fatal occupational injuries among Hispanic workers by sex, 1992-2002. In 2002, male workers accounted for about 94% of all fatal occupational injuries among Hispanic workers. During this period, fatal occupational injuries among Hispanic female workers ranged from 21 in 1992 to 54 in 2001. (Source: BLS [2003d].) |
Occupation
How did fatal occupational injuries differ by major occupational group among Hispanic workers during 1992–2002?
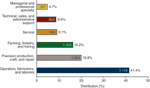 | Figure 5-36 Distribution and number of fatal occupational injuries among Hispanic workers by occupation, 1992-2002. During this period, three occupational groups accounted for nearly 77% of all fatal occupational injuries among Hispanic workers: operators, fabricators, and laborers (41.4% or 3,128 cases), precision production, craft, and repair occupations (19.9% or 1,504 cases), and farming, forestry, and fishing (16.2% or 1,225 cases). (Source: BLS [2003d].) |
Industry
How did fatal occupational injuries differ by major private industry sector among Hispanic workers during 1992–2002?
 | Figure 5-37 Distribution and number of fatal occupational injuries among Hispanic workers by industry, 1992-2002. During this period, the largest proportion of fatal occupational injuries among Hispanic workers was in construction, which accounted for 27.7% of the total, or 1,994 cases. (Source: BLS [2003d].) |
Event or Exposure
How did fatal occupational injuries differ by event or exposure among Hispanic workers during 1992–2002?
 | Figure 5-38 Distribution and number of fatal occupational injuries among Hispanic workers by event or exposure, 1992-2002. Transportation incidents accounted for 33.7% of fatal occupational injuries among Hispanic workers during 1992-2002. Other events or exposures that accounted for substantial proportions of fatal injuries included assaults and violent acts (20.6%), contact with objects and equipment (16.7%), and falls (15.0%). The 2,593 transportation fatalities were primarily associated with incidents on highways (1,427 cases) or on farm or industrial premises (368 cases), or with incidents in which workers were struck by a vehicle or mobile equipment (562 cases). (Source: BLS [2003d].) |
Nonfatal Injuries and Illnesses
Magnitude and Trend
How did nonfatal occupational injuries and illnesses involving days away from work differ by race/ethnicity among Hispanic and non-Hispanic workers in 2001?
 | Figure 5-39 Distribution and number of nonfatal occupational injuries and illnesses involving days away from work in private industry by race/ethnicity among Hispanic and non-Hispanic workers, 2001. Among cases reporting race/ethnicity in 2001, white, non-Hispanic workers accounted for 68.2% of the cases involving days away from work. Hispanic workers represented 17.1% of the cases involving days away from work, and black, non-Hispanic workers accounted for 11.9%. (Note: Race/ethnicity was not reported for 415,616 of the 1.5 million cases involving days away from work in 2001). (Source: BLS [2003b].) |
How did nonfatal occupational injuries and illnesses involving days away from work change among Hispanic workers during 1992–2001?
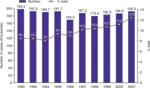 | Figure 5-40 Annual number and percentage of nonfatal occupational injuries and illnesses involving days away from work among Hispanic workers in private industry, 1992-2001. Cases of nonfatal occupational injury and illness with days away from work among Hispanic workers ranged from 198,022 in 1992 to 169,300 in 1996. The decrease for 1992-1996 contrasts with the increase for 1996-2001, when reported cases increased from 169,300 cases to 191,959. When presented as a percentage of all nonfatal occupational injuries and illnesses with days away from work, the cases among Hispanic workers show a fairly consistent upward trend, from 8.5% in 1992 to 12.5% in 2001. (Sources: BLS 2003b,c].) |
Severity
How did nonfatal occupational injuries and illnesses involving days away from work vary by severity among non-Hispanic and Hispanic workers in 2001?
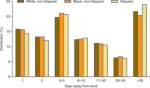 | Figure 5-41 Distribution of nonfatal occupational injuries and illnesses involving days away from work in private industry among non-Hispanic and Hispanic workers by number of days away from work, 2001. Compared with white, non-Hispanic or black workers, Hispanic workers had the lowest percentages of short-term work loss (1 or 2 days) and the highest percentage of long-term work loss (31 days or more). (Sources: BLS [2003b,c].) |
Occupation
How did nonfatal occupational injuries and illnesses among Hispanic workers differ by major occupational group in 2001?
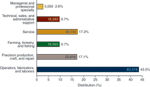 | Figure 5-42 Distribution and number of nonfatal occupational injuries and illnesses involving days away from work among Hispanic workers in private industry by occupation, 2001. Among Hispanic workers, the distribution of nonfatal occupational injury and illness cases involving days away from work by occupation shows the highest proportion of cases (43.5% or 83,319 cases) among operators, fabricators, and laborers. Service and precision production, craft, and repair accounted for 17.3% (33,140 cases) and 17.1% (32,816 cases), respectively. (Sources: BLS [2003b,c].) |
Industry
How did nonfatal occupational injuries and illnesses involving days away from work differ by major private industry sector among Hispanic workers in 2001?
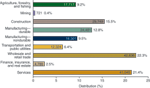 | Figure 5-43 Distribution and number of nonfatal occupational injuries and illnesses involving days away from work among Hispanic workers by industry, 2001. Among the total 191,959 cases of nonfatal occupational injury and illness, wholesale and retail trade and services accounted for the largest percentages of Hispanic cases (22.3% and 21.4%, respectively). (Sources: BLS [2003b,c].) |
