Daily Snow and Sea Ice Temperature over the North Pole
|
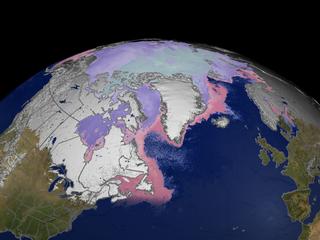
This animation shows the global advance and retreat of daily snow cover along with daily sea ice surface temperature over the Northern Hemisphere from September 2002 through May 2003. The snow cover was measured by the MODIS instrument on the Terra satellite, while the sea ice surface temperature was measured by the MODIS instrument on the Aqua satellite. Since these instruments cannot take measurements through clouds, in cloud-covered regions or areas with suspect data quality, the prior day's value is retained until a valid data reading is obtained. This visualization designates an area as covered by snow when the instrument takes a valid measurement showing greater than ~50% snow coverage in that area. This area is assumed to be snow covered until the instrument takes a valid measurement showing less than 40% snow coverage in that same area. A color bar indicates the sea ice surface temperature values. The satellite instruments are unable to collect data through darkness. The region in polar darkness is shown as a gray cap over the pole that grows and shrinks seasonally. A date slider indicates the progression of time. SeaWiFS Land Reflectance shows the seasonal changes in land cover.
|
|
|
|
This animation shows the daily advance and retreat of snow cover, and sea ice surface temperature over the North Pole during the winter of 2002-2003.
Duration: 1.9 minutes
Available formats:
720x400 (30 fps)
MPEG-1
58 MB
320x177
JPEG
12 KB
512x288 (30 fps)
MPEG-1
15 MB
320x180
JPEG
11 KB
720x480 (29.97 fps)
MPEG-2
91 MB
1280x720 (30 fps)
Multiplexed
MPEG-2
247 MB
1280x720 (30 fps)
Frames (TimeBarOverlay)
1280x720 (30 fps)
Frames (NPoleSnowIce)
How to play our movies
|
|
|
|
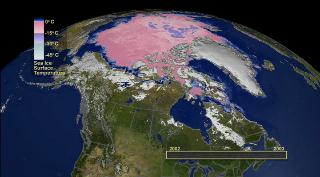
This image shows the snow cover and sea ice surface temperature over the North Pole on March 23, 2003.
Available formats:
2560 x 1920
TIFF
6 MB
160 x 80
PNG
25 KB
320 x 240
JPEG
12 KB
80 x 40
PNG
7 KB
|
|
|
|
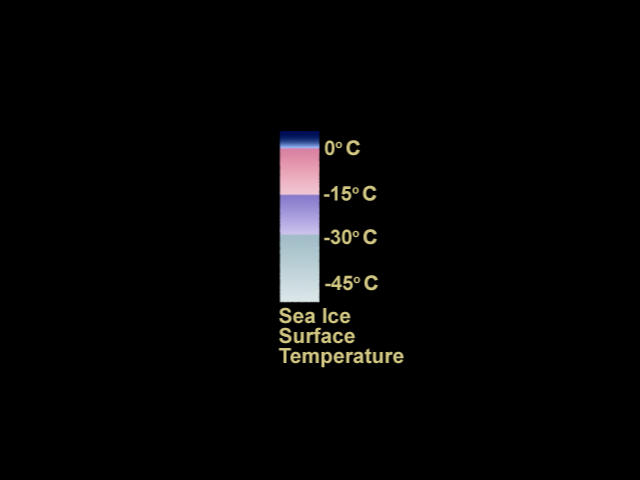
This color bar shows the colors used to represent the sea ice surface temperature. The coldest water is shown in light blue. The warmest sea ice is shown in shades of pink. As the sea ice surface temperatures cool below -15 degrees Celsius, the color is shown in shades of purple. The sea ice surface below -28 degrees Celsius is shown in shades of blue-grey.
Available formats:
640 x 480
TIFF
120 KB
640 x 480
JPEG
1 KB
|
|
|
Back to Top
|

