Navigation, Contact Info, and Legend for the OSH Website
• View By Topic
• Quick Links
Contact Info
Centers for Disease Control and Prevention
National Center for Chronic Disease Prevention and Health Promotion
Office on Smoking and Health
Tel: 1-800-CDC-INFO
(1-800-232-4636)
TTY: 1-888-232-6348
E-mail: tobaccoinfo@cdc.gov
Legend
 = Link to a PDF document
(Adobe Acrobat™ Reader needs to be installed on your computer in order to read PDF documents.)
Download the Reader
 = Link to nonfederal Web site
Disclaimer on nonfederal Web sites
Cigarette Production, Exports, and Domestic Consumption—United States, 1990–2007
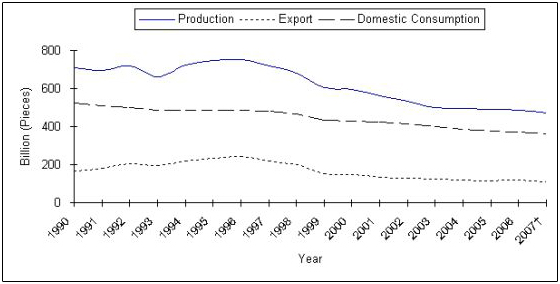
The line graph above shows U.S. cigarette production, exports, and consumption between 1990 and 2007.
During that 17-year period, cigarette production decreased by about 34%, exports decreased by about 34%,
and consumption dropped by about 31%. The percentage value by year for each category is as follows:
| Year |
Production |
Exports |
Total Consumption |
| 1990
| 709.7 |
164.3 |
525.0 |
| 1991
| 694.5 |
179.2 |
510.0 |
| 1992
| 718.5 |
205.6 |
500.0 |
| 1993
| 661.0 |
195.5 |
485.0 |
| 1994
| 725.5 |
220.2 |
486.0 |
| 1995
| 746.5 |
231.1 |
487.0 |
| 1996
| 754.5 |
243.9 |
487.0 |
| 1997
| 719.6 |
217.0 |
480.0 |
| 1998
| 679.7 |
201.3 |
465.0 |
| 1999
| 606.6 |
151.4 |
435.0 |
| 2000
| 594.6 |
148.3 |
430.0 |
| 2001
| 562.4 |
133.9 |
425.0 |
| 2002
| 532.0 |
127.4 |
415.0 |
| 2003
| 499.4 |
121.5 |
400.0 |
| 2004
| 493.5 |
118.6 |
388.0 |
| 2005
| 489.0 |
113.3 |
376.0 |
| 2006
| 484.0 |
119.0 |
372.0 |
| 2007†
| 471.6 |
108.9 |
360.0 |
†2007 are estimated
Source:
Tobacco Yearbooks, Economic Research Service, USDA
Page last reviewed 04/17/2008
Page last modified 04/17/2008