|
/ Climate Monitoring / 2006 / Latest Monthly Report / Wildfires / Help
Climate of 2006
Wildfire Season Summary
National Climatic Data Center
Last Updated - 11 January 2007
|
Global Analysis / Global Hazards / United States Overview / U.S. Drought / Extremes
Use these links to access detailed analyses of Global and U.S. data.
 / 2005 SEASON / JANUARY / FEBRUARY / MARCH / APRIL / MAY / JUNE / JULY/ AUGUST /SEPTEMBER /OCTOBER /NOVEMBER-DECEMBER /
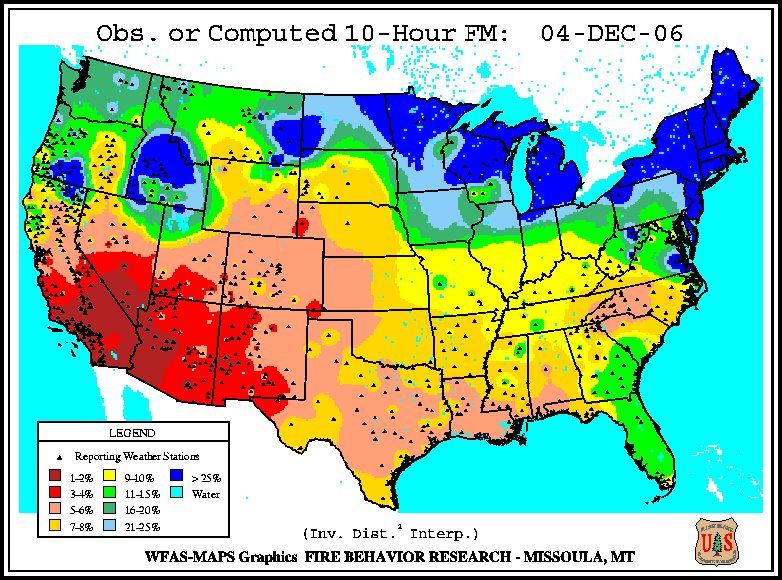
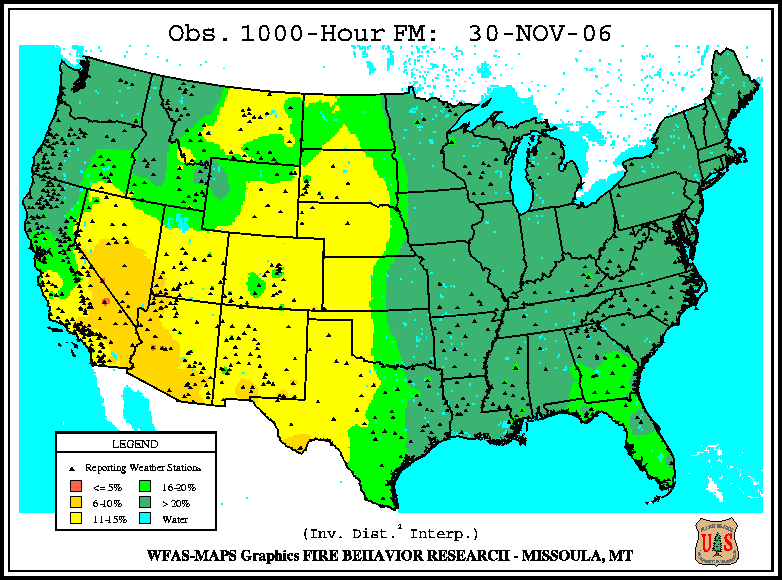
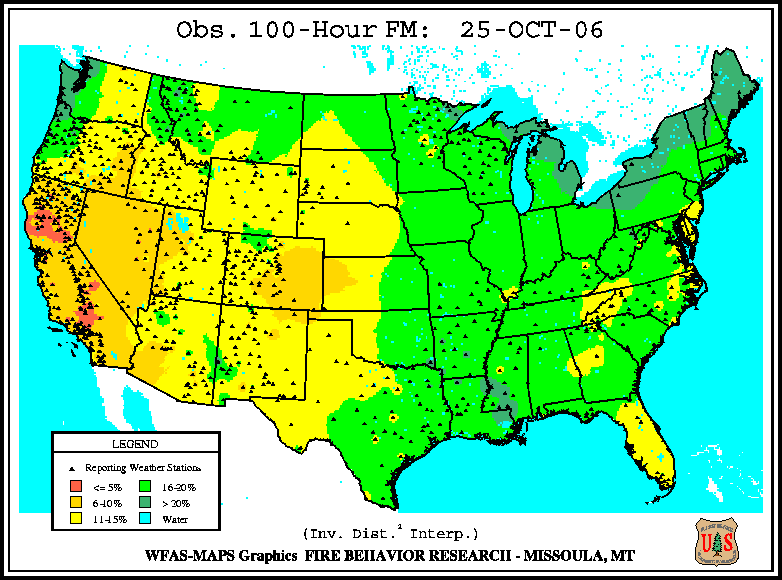
Dead fuel moisture levels remained very dry mostly in the Southwest in November. The 10-hour fuel moisture levels on 4 December were extremely dry in southern California, southern Nevada and western Arizona. Medium fuels (30 November 100-hr) were extremely dry in an area of southern Nevada and western Arizona. Larger fuels (30 November 1000-hr) remained unusually dry over the past month from the California-Arizona Mexico border northward into central Nevada.
The Keetch-Byram Drought Index (KBDI), a widely used index for fire risk, had the largest potential for wildland fire activity in the contiguous U.S. in southern California, Nevada, southwestern Arizona, and in eastern Georgia and the northern Florida peninsula. The observed experimental fire potential index at the beginning of December was anomalously high from southern California eastward through southern Nevada, Arizona, and western New Mexico.

Historical U.S. Patterns
|
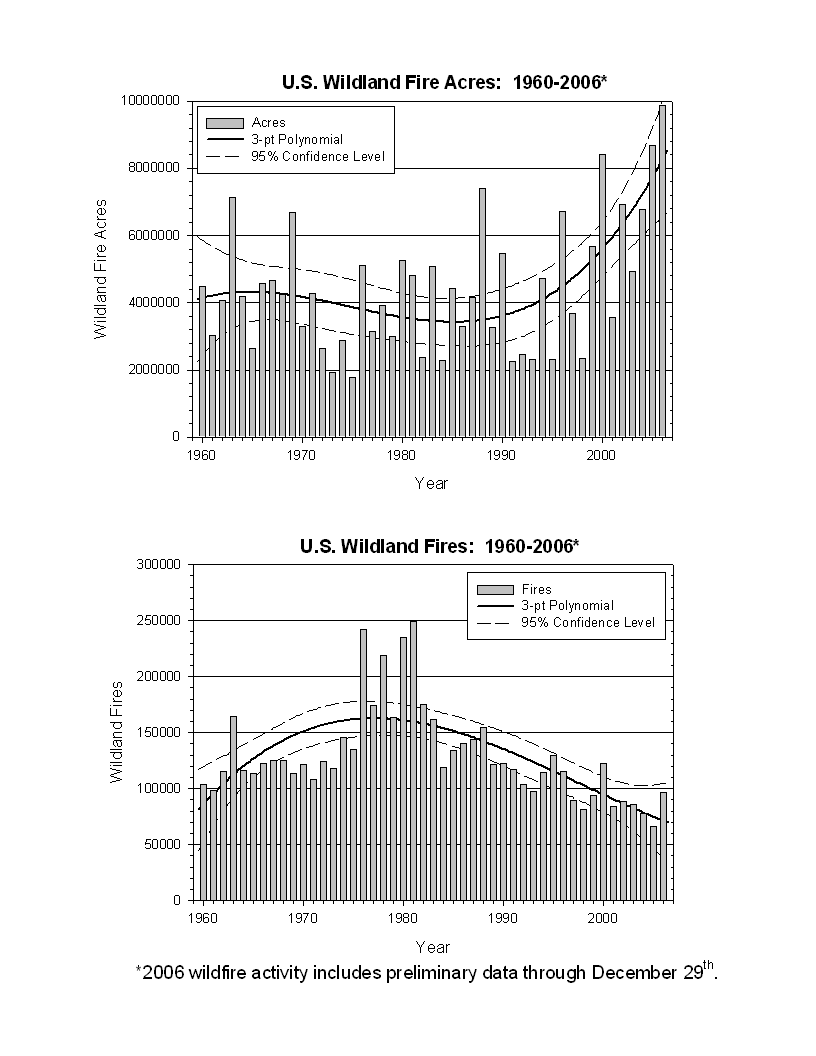
2006 Wildfire Statistics (from NIFC):
|
Totals |
Nationwide Number of
Fires |
Nationwide Number of
Acres Burned |
| 12/29/2006
|
96,326 |
9,871,863 |
| 12/31/2005 |
66,552 |
8,686,753 |
| 12/31/2004 |
77,534 |
6,790,692 |
| 12/31/2003 |
85,943 |
4,918,088 |
| 12/31/2002 |
88,458 |
6,937,584 |
| 12/31/2001 |
84,079 |
3,555,138 |
| 12/31/2000 |
122,827 |
8,422,237 |
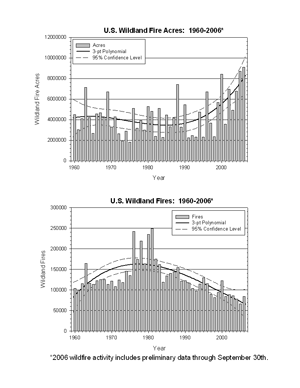
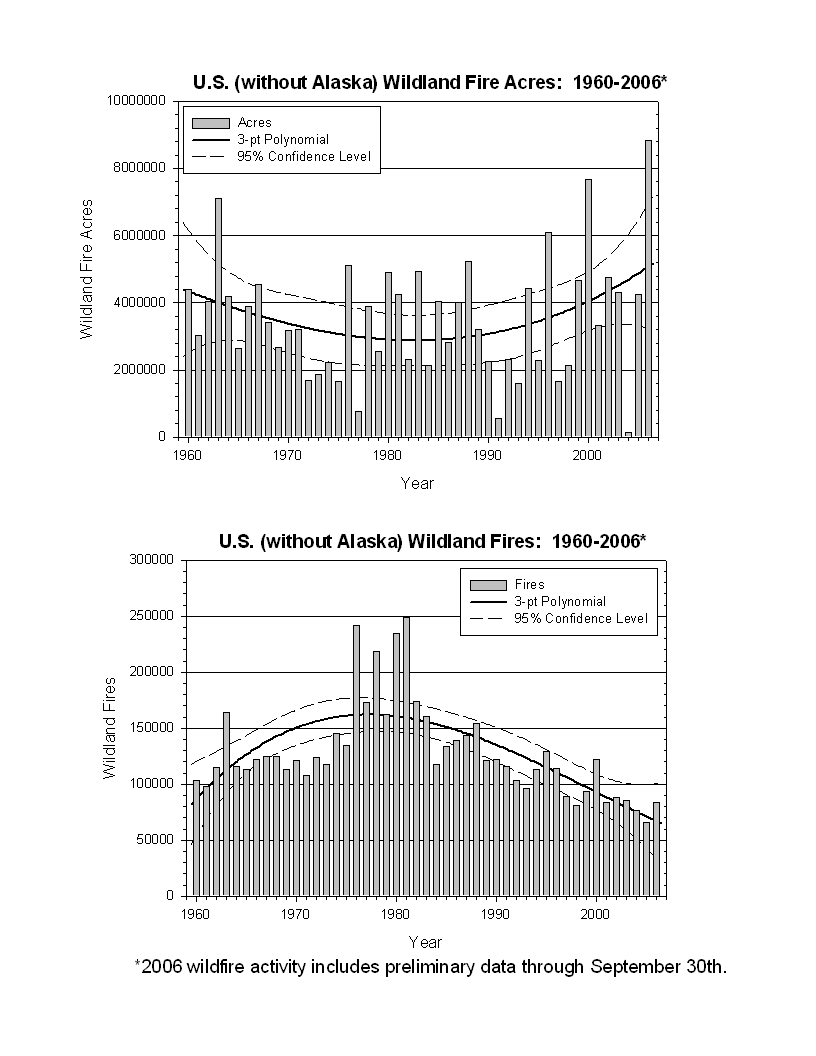
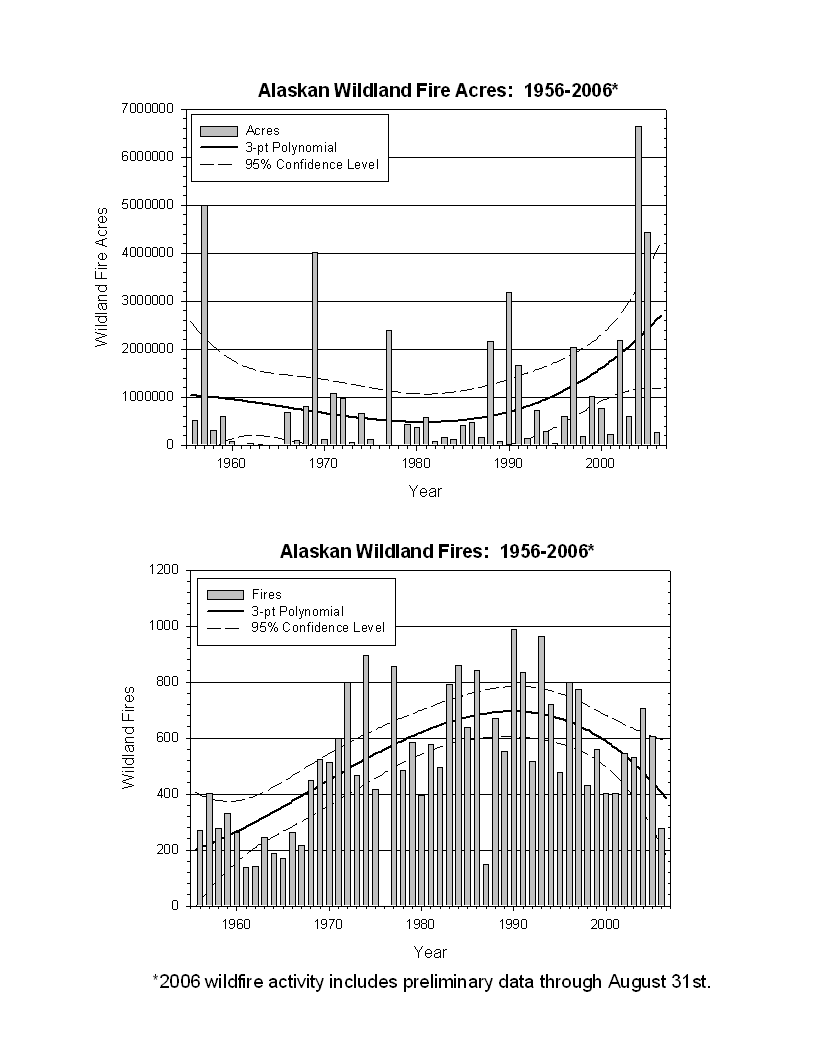
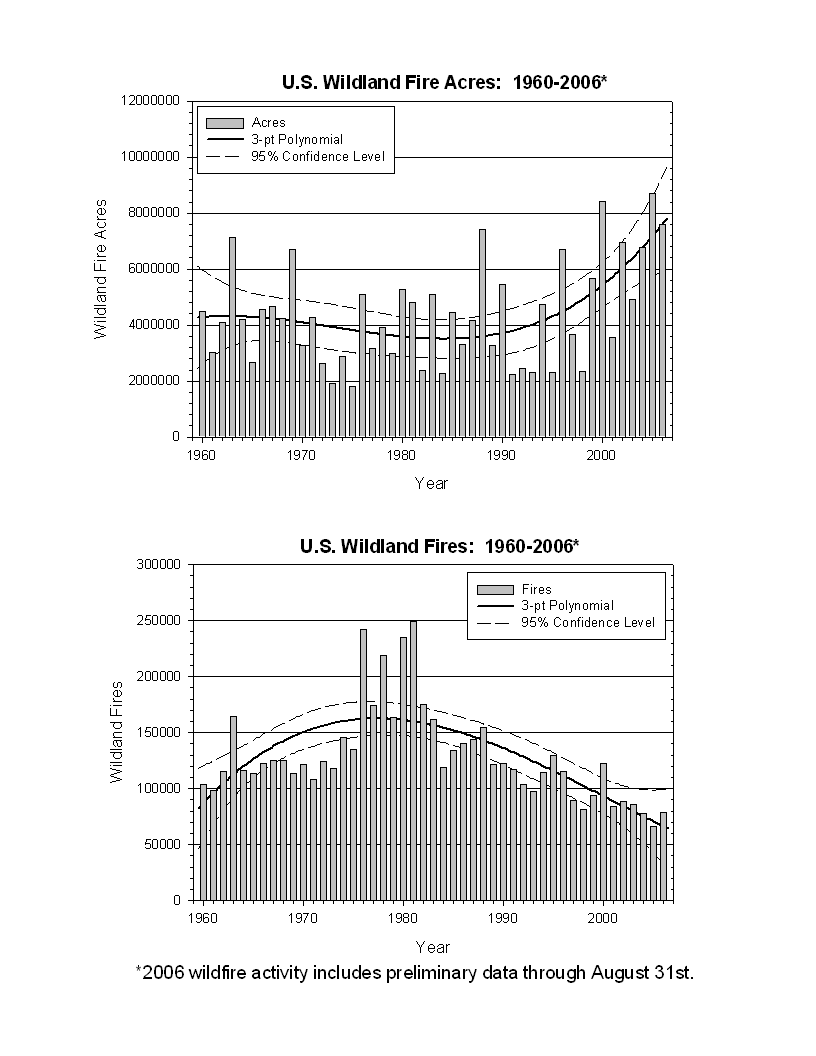
Historically, the graphs below show that the number of fires has been decreasing since the 1980s. However, the number of acres burned has been increasing. In Alaska the number of fires was the highest in the early 1990s.

Alaska Patterns
|

Canadian Large Fires - 26 October 2006
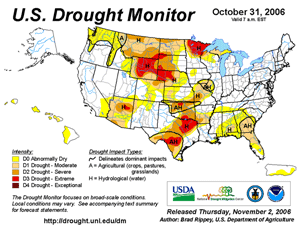
U.S. Drought Monitor map from 31 October 2006
|
Although drought persisted in the middle of the country in October, large wildland fire activity was concentrated in western Canada. In the U.S. the major incident was the Esperanza fire in southern California at the end of the month. Caused by arson, the fire consumed over 40,000 acres and led to the deaths of 5 firefighters and the destruction of 34 homes.
As of end of October, there have been about 84,500 wildland fires across the Lower 48 States since the beginning of 2006, and over 9.4 million acres were burned, according to estimates from the National Interagency Fire Center.
The preliminary number of acres burned so far this year in the U.S. is a record for an entire year. Over half of the fires and a quarter of the burned acreage occurred in the Southern Area (which encompasses 13 states, Puerto Rico, the Virgin Islands and the District of Columbia).
|
Dead fuel moisture levels remained very dry mostly in the West in October. The 10-hour fuel moisture levels on October 25 were extremely dry throughout California and southern Nevada. Medium fuels (October 25 100-hr) were extremely dry in an area of northern California and in another area in southern California. Larger fuels (October 25 1000-hr) remained unusually dry over the past month from the California-Arizona-Mexico border northward into Washington and Idaho.
The Keetch-Byram Drought Index (KBDI), a widely used index for fire risk, had the largest potential for wildland fire activity in the contiguous U.S. in California, along the Oregon coast, and in the northern and central Florida peninsula. The observed experimental fire potential index at the end of October was anomalously high for one large area from southern California and to northern Nevada.

Historical U.S. Patterns
|
2006 Wildfire Statistics (from NIFC):
|
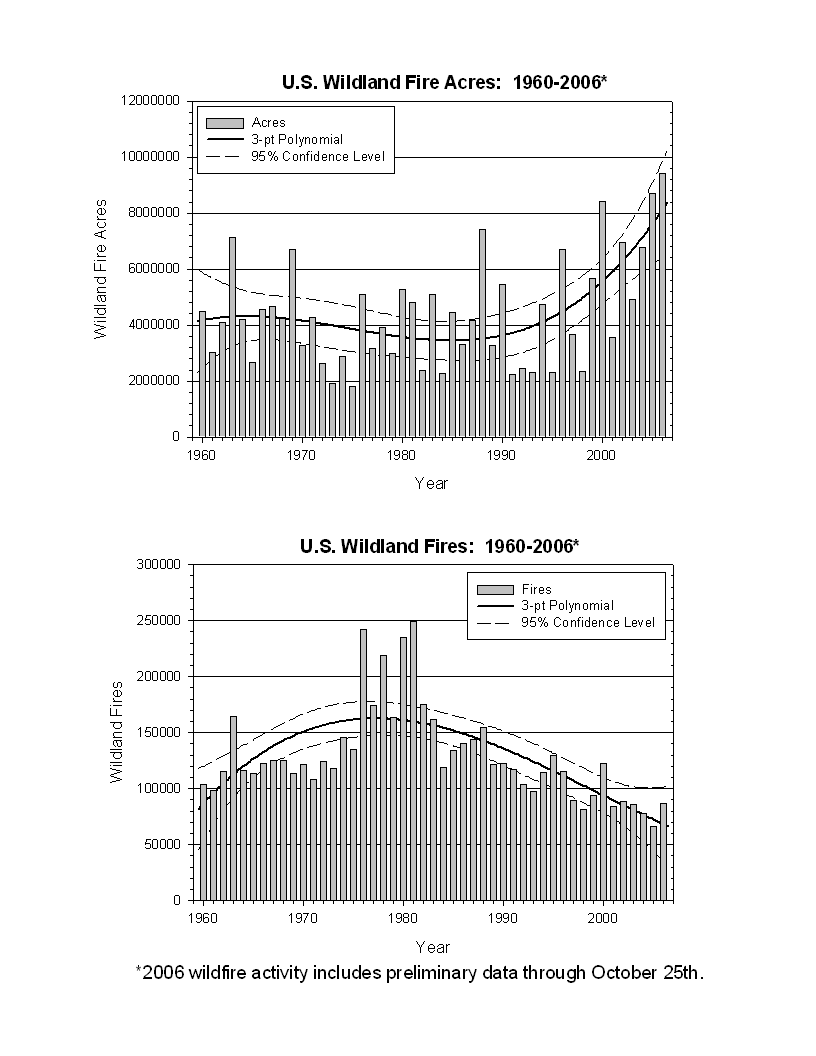
Totals as of late October |
Nationwide Number of
Fires |
Nationwide Number of
Acres Burned |
| 10/30/2006
|
86,545 |
9,442,610 |
| 10/30/2005 |
56,589 |
8,256,081 |
| 10/30/2004 |
62,852 |
8,042,281 |
| 10/30/2003 |
55,533 |
3,337,304 |
| 10/30/2002 |
69,274 |
6,707,556 |
| 10/30/2001 |
66,290 |
3,779,562 |
| 10/30/2000 |
86,418 |
7,025,680 |
Historically, the graphs below show that the number of fires has been decreasing since the 1980s. However, the number of acres burned has been increasing. In Alaska the number of fires was the highest in the early 1990s.

Alaska Patterns
|

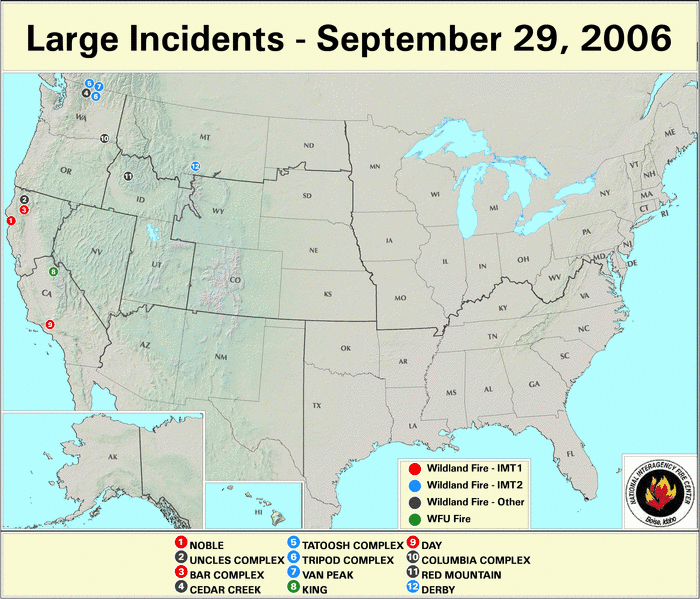
Large fires - 29 September 2006

U.S. Drought Monitor map from 26 September 2006
|
Although drought persisted in the middle of the country in September, large wildland fire activity was concentrated in the northwest U.S. and Canada.
As of end of September, there have been about 84,000 wildland fires across the Lower 48 States since the beginning of 2006, and over 9 million acres were burned, according to estimates from the National Interagency Fire Center.
The preliminary number of acres burned so far this year in the U.S. is a record for an entire year. Over half of the fires and a quarter of the burned acreage occurred in the Southern Area (which encompasses 13 states, Puerto Rico, the Virgin Islands and the District of Columbia).
|
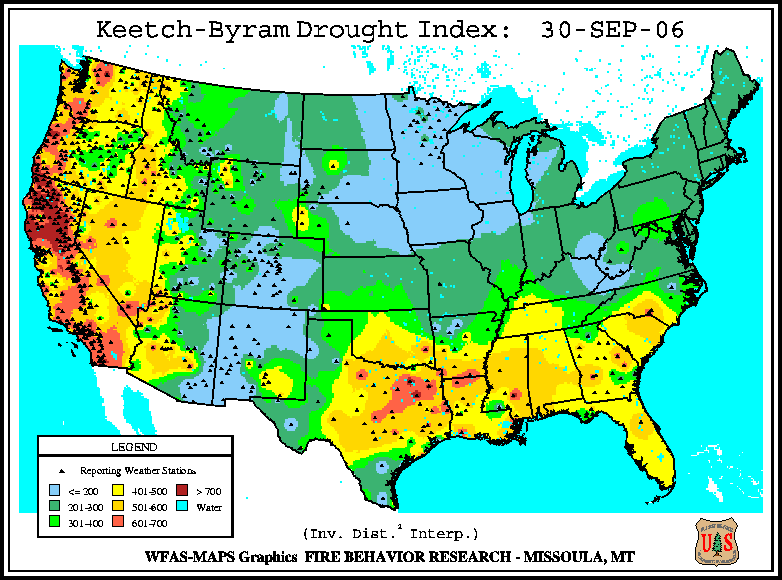
Dead fuel moisture levels remained very dry in September. The 10-hour fuel moisture levels on October 1 were extremely dry throughout most of the West and western Plains.
Medium to larger fuels (i.e., the September 30 100-hr and September 30 1000-hr fuel moistures) remained unusually dry over the past month from the California-Arizona-Mexico border northward into Utah, Oregon and Idaho.
The Keetch-Byram Drought Index (KBDI), a widely used index for fire risk, had the largest potential for wildland fire activity in the contiguous U.S. along the West Coast and in the South from Texas to Georgia by the end of the month. In addition, the observed experimental fire potential index at the end of September was anomalously high for one large area from southern California and Arizona northward into Oregon, Idaho and Wyoming.
Historical Lower 48 States Patterns
|
2006 Wildfire Statistics (from NIFC):
|
Totals as of early October |
Nationwide Number of
Fires |
Nationwide Number of
Acres Burned |
| 10/5/2006
|
84,333 |
9,080,628 |
| 10/5/2005 |
54,051 |
8,175,432 |
| 10/5/2004 |
61,625 |
7,733,023 |
| 10/5/2003 |
50,022 |
3,161,924 |
| 10/5/2002 |
67,889 |
6,657,464 |
| 10/5/2001 |
63,737 |
3,265,574 |
| 10/5/2000 |
82,071 |
6,891,292 |
Historically, the graphs below show that in the lower 48 states, the number of fires has been decreasing since the 1980s. However, the number of acres burned has been increasing. In Alaska the pattern is similar to the lower 48 states, but the number of fires was the highest in the early 1990s.
Historical Alaska Patterns
|

Large fires - 31 August 2006

U.S. Drought Monitor map from 29 August 2006
|
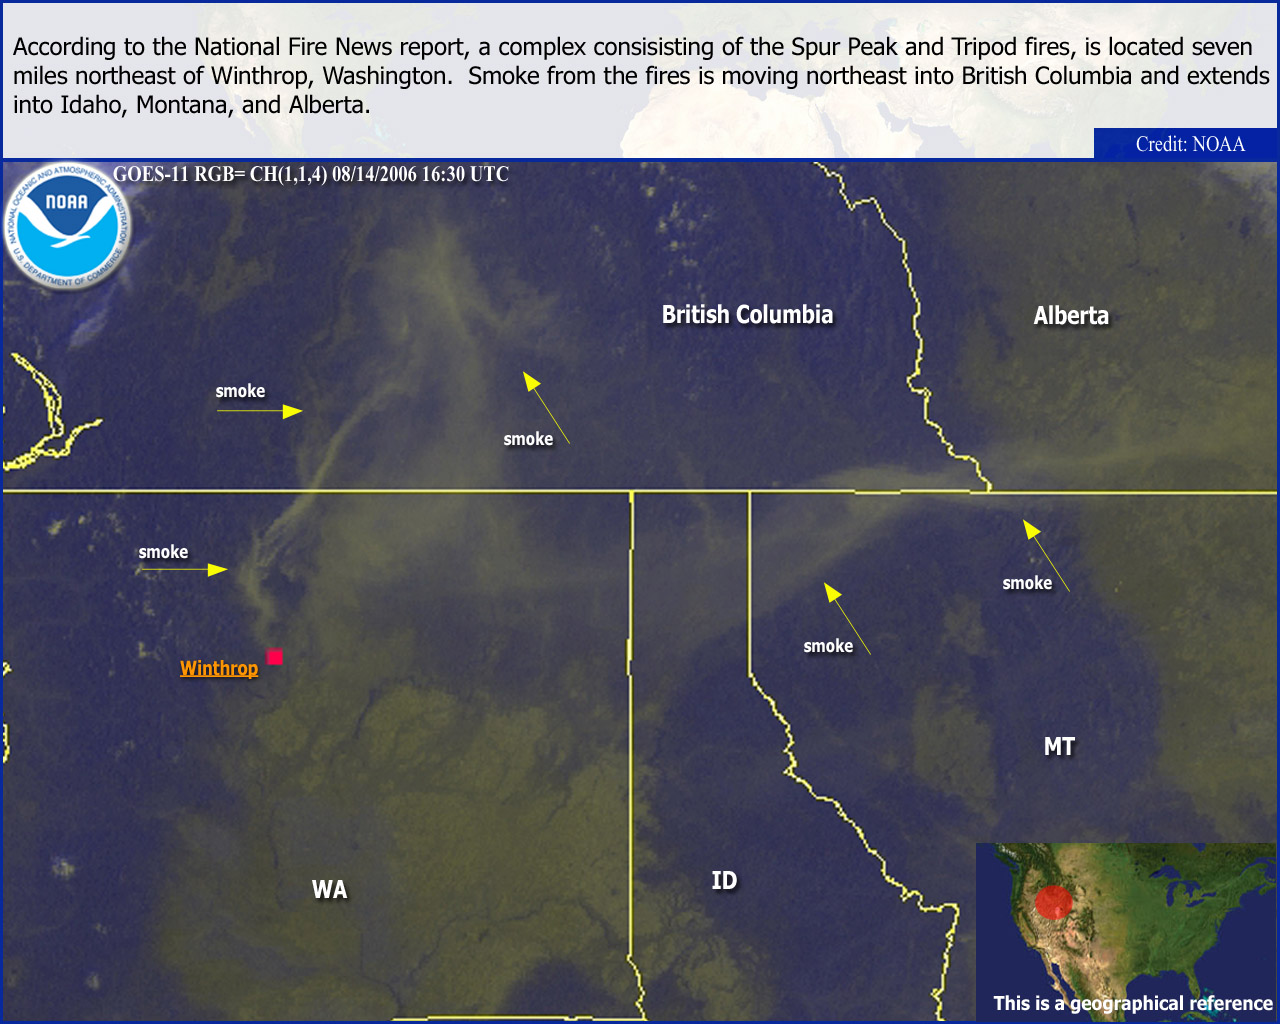
Although drought persisted in the middle of the country in August, wildland fire activity was concentrated in the Northwest. Smoke and reduced visibilities are major impacts of the fires. A large smoke plume spreading into British Columbia from a Washington wildfire was graphically depicted by a satellite image.
As of August 27, there were more than 78,000 wildland fires across the Lower 48 States since the beginning of 2006, and over 7.5 million acres were burned, according to estimates from the National Interagency Fire Center.
Of the total acreage, almost 2.5 million acres have burned in the Southern Area (which encompasses 13 states, Puerto Rico, the Virgin Islands and the District of Columbia).
|
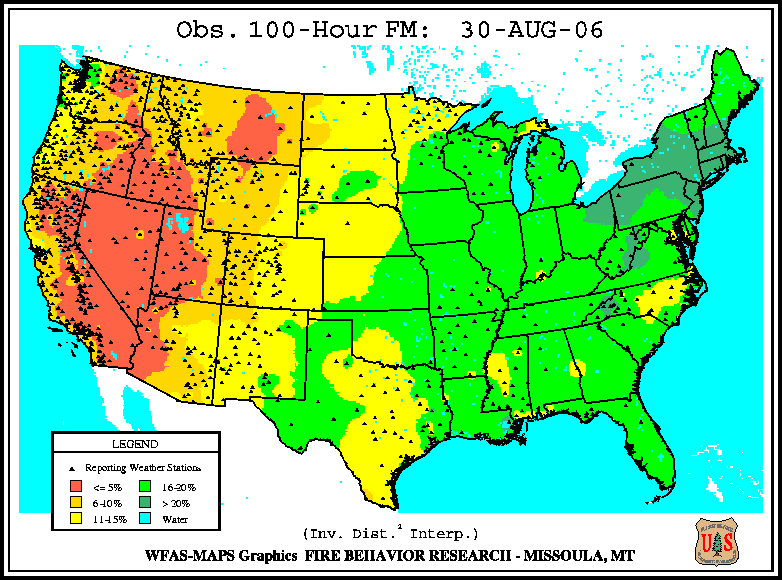
Dead fuel moisture levels remained very dry in August. The 10-hour fuel moisture levels on August 30 were extremely dry, with the observed levels below 5% across a swath from California to the Dakotas.
Medium to larger fuels (i.e., the August 30 100-hr and August 30 1000-hr fuel moistures) also remained unusually dry over the past month, especially from southern California to southern Oregon and Idaho as well as in eastern Montana.
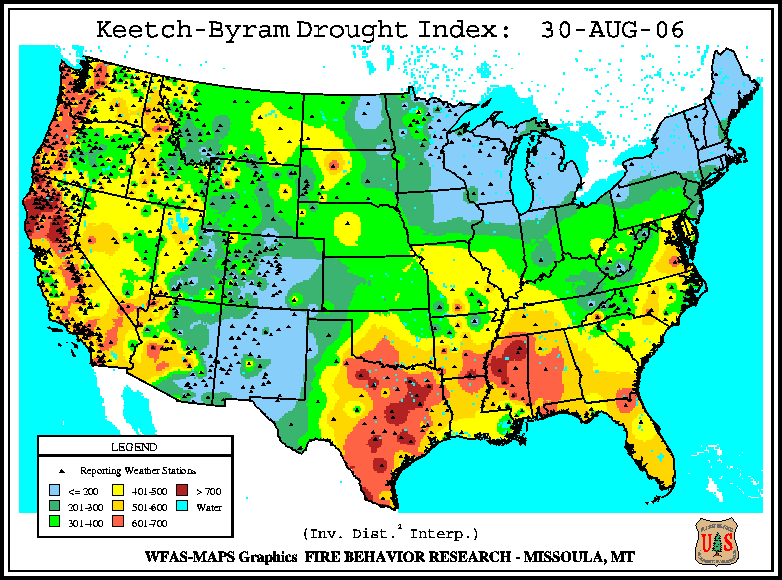
The Keetch-Byram Drought Index (KBDI), a widely used index for fire risk, had the largest potential for wildland fire activity in the contiguous U.S. along the West Coast and in the South from Texas to Georgia by the end of the month. In addition, the observed experimental fire potential index at the end of August was anomalously high for one large area from southern California northward into Oregon and Idaho and for another large area from Arizona through eastern Montana.

Historical Lower 48 States Patterns
|
2006 Wildfire Statistics (from NIFC):
|
Totals as of early September |
Nationwide Number of
Fires |
Nationwide Number of
Acres Burned |
| 9/4/2006
|
83,638 |
8,098,182 |
| 9/4/2005 |
46,289 |
7,726,359 |
| 9/4/2004 |
55,512 |
7,584,945 |
| 9/4/2003 |
45,408 |
2,811,592 |
| 9/4/2002 |
63,162 |
6,328,733 |
| 9/4/2001 |
58,654 |
2,957,158 |
| 9/4/2000 |
74,571 |
6,566,520 |
Historically, the graphs below show that in the lower 48 states, the number of fires has been decreasing since the 1980s. However, the number of acres burned has been increasing. In Alaska the pattern is similar to the lower 48 states, but the number of fires was the highest in the early 1990s.
Historical Alaska Patterns
|

Large fires - 31 July 2006

U.S. Drought Monitor map from 1 August 2006
|
Wildland fire activity was above normal during July, continuing the anomalous activity since the beginning of 2006. Fires affected many parts of the western half of the country during the month as well as in the western half of Canada. Smoke and reduced visibilities are major impacts of the fires. A large smoke plume from a Washington wildfire was graphically depicted by a satellite image.
As of August 1st, there were almost 71,000 wildland fires across the Lower 48 States since the beginning of 2006, and over 5.6 million acres were burned, according to estimates from the National Interagency Fire Center.
Of the total acreage, approximately 2 million acres have burned in the Southern Area (which encompasses 13 states, Puerto Rico, the Virgin Islands and the District of Columbia).
|
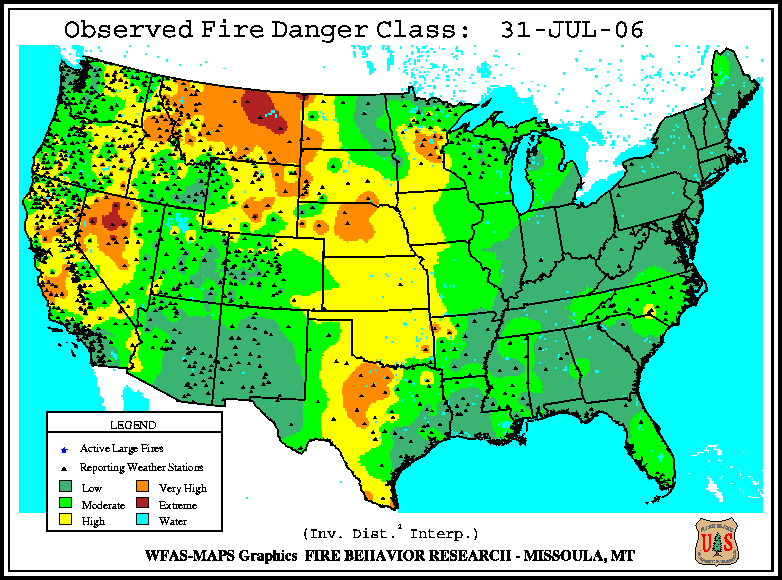
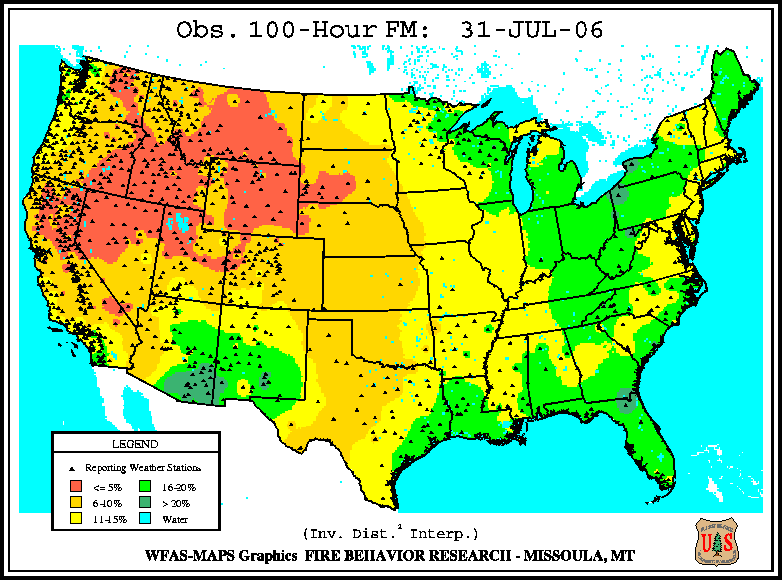
Dead fuel moisture levels remained very dry in July. The 10-hour fuel moisture levels on July 31st were extremely dry, with the observed levels below 5% across a swath from California to the Dakotas.
Medium to larger fuels (i.e., the July 31st 100-hr and July 31st 1000-hr fuel moistures) also remained unusually dry over the past month, especially from northern California to the Dakotas.
The Keetch-Byram Drought Index (KBDI), a widely used index for fire risk, had the largest potential for wildland fire activity in the contiguous U.S. in the South from Texas to Georgia by the end of the month. In addition, the observed experimental fire potential index at the end of July was anomalously high for one large area from southern California northward to Washington and Idaho and for another large area in central and eastern Montana and Wyoming and the western Dakotas.
For further information on drought conditions across the U.S. go to the July drought summary page.
|
2006 Wildfire Statistics (from NIFC):
|
Totals as of early August |
Nationwide Number of
Fires |
Nationwide Number of
Acres Burned |
| 8/8/2006
|
73,193 |
5,905,804 |
| 8/8/2005 |
39,896 |
5,005,845 |
| 8/8/2004 |
50,211 |
5,573,271 |
| 8/8/2003 |
38,080 |
1,899,486 |
| 8/8/2002 |
54,376 |
4,727,730 |
| 8/8/2001 |
56,004 |
1,617,427 |
| 8/8/2000 |
63,623 |
4,034,362 |
Fire Danger Class map from 31 July 2006
|

Large fires - 30 June 2006

U.S. Drought Monitor map from 27 June 2006
|
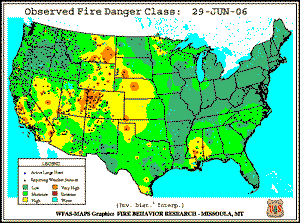
Wildland fire activity was above normal during June, continuing the anomalous activity since the beginning of 2006. Fires continued to affect parts of the Southwest during the month, while activity developed in northern California, western Nevada and southern Oregon. Smoke and reduced visibilities are major impacts of the fires. The Gila National Forest, New Mexico wildfire produced a large smoke plume that is graphically depicted by a satellite image.
There have been over 61,000 wildland fires across the Lower 48 States since the beginning of 2006, with large fire activity focused in the Plains, the Southwest and the Florida peninsula. As of July 9th, over 4 million acres have burned across the U.S., according to estimates from the National Interagency Fire Center.
Of the total acreage, approximately 2 million acres have burned in the Southern Area (which encompasses 13 states, Puerto Rico, the Virgin Islands and the District of Columbia).
|
Dead fuel moisture levels remained very dry in June. The 10-hour fuel moisture levels on June 29th were extremely dry, with the observed levels below 5% across parts of the High Plains and Southwest states.
Medium to larger fuels (i.e., the June 29th 100-hr and June 29th 1000-hr fuel moistures) also remained unusually dry over the past month, especially across New Mexico, Nevada, Utah, Colorado, Wyoming and eastern Montana.
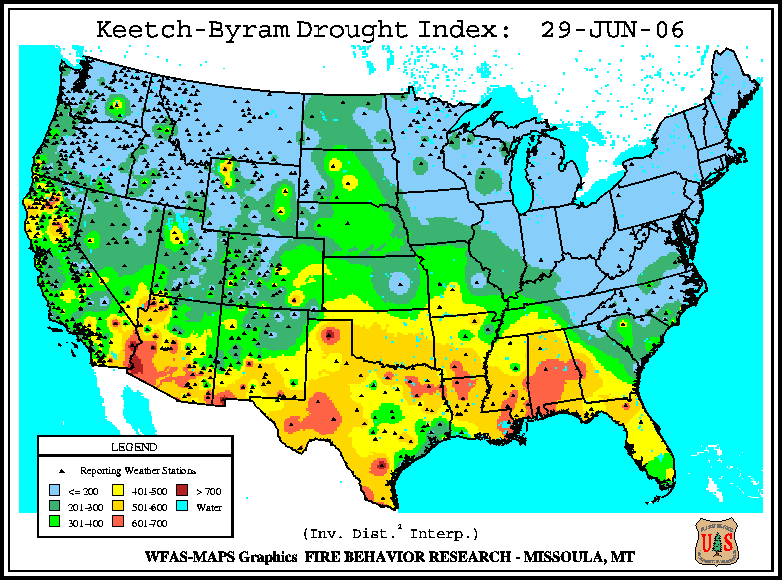
The Keetch-Byram Drought Index (KBDI), a widely used index for fire risk, had the largest potential for wildland fire activity in the contiguous U.S. across the Southwest to Florida by the end of the month. In addition, the observed experimental fire potential index at the end of June was anomalously high for a large area of the Southwest northward into Colorado and Wyoming.
For further information on drought conditions across the U.S. go to the June drought summary page.
|
2006 Wildfire Statistics (from NIFC):
|
Totals as of early July |
Nationwide Number of
Fires |
Nationwide Number of
Acres Burned |
| 7/9/2006
|
61,418 |
4,002,383 |
| 7/9/2005 |
31,632 |
3,006,282 |
| 7/9/2004 |
40,646 |
2,989,977 |
| 7/9/2003 |
29,125 |
993,934 |
| 7/9/2002 |
45,617 |
3,155,402 |
| 7/9/2001 |
43,693 |
1,240,789 |
| 7/9/2000 |
51,342 |
2,207,704 |
Fire Danger Class map from 29 June 2006
|
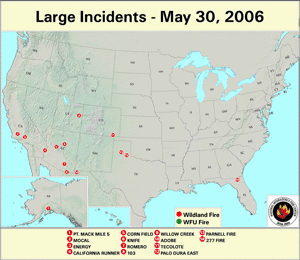
Large fires - 30 May 2006

U.S. Drought Monitor map from 30 May 2006
|
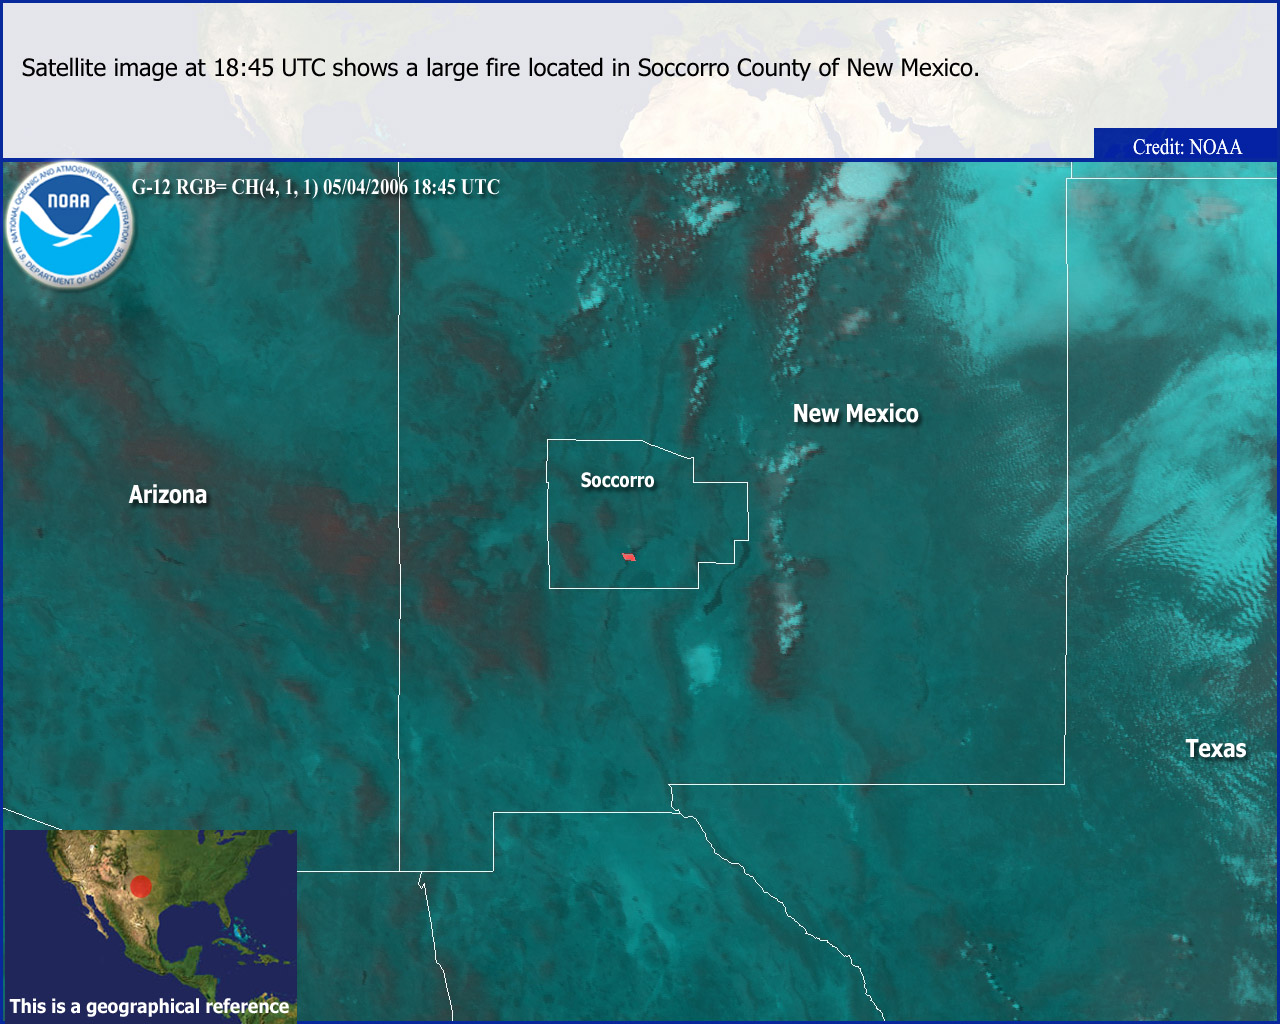
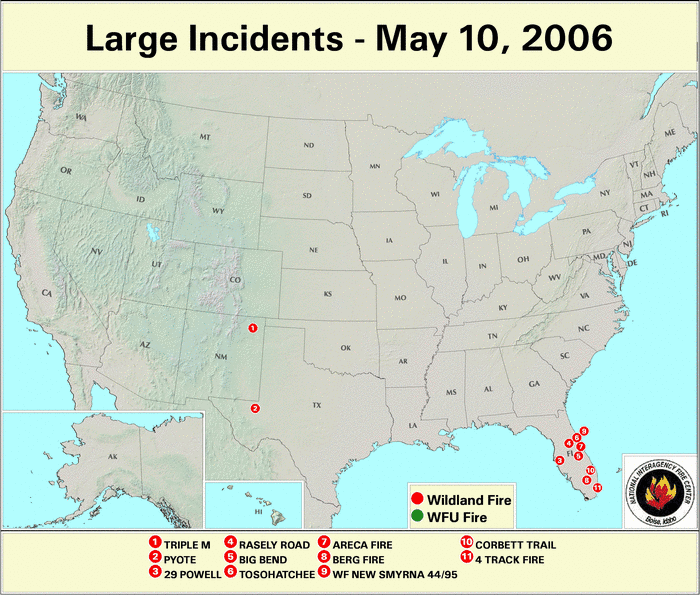
Wildland fire activity increased during the past month across parts of the Southwest U.S., with fires developing in New Mexico in early May. Fires also developed in Southern California later in the month. In early June, fire activity began to affect parts of Alaska, with large fires developing in the Yukon Delta region.
Since the beginning of 2006, large fire activity focused primarily in the central and southern Plains, the Southwest and the Florida peninsula. As of June 7th, over 44,000 fires and over 2.6 million acres have burned across the contiguous U.S. and Alaska, according to estimates from the National Interagency Fire Center (NIFC). Of the total acreage, approximately 1.88 million acres have burned in the Southern Area (which encompasses 13 states, Puerto Rico, the Virgin Islands and the District of Columbia).
Fire activity also increased across Canada over the past month. As of May 31st, there have been 2180 fires and 41,807 hectares (103,307 ac) burned across Canada this year. For the latest information on the fire season in Canada visit the Canadian Interagency Forest Fire Center (CIFFC) website.
|
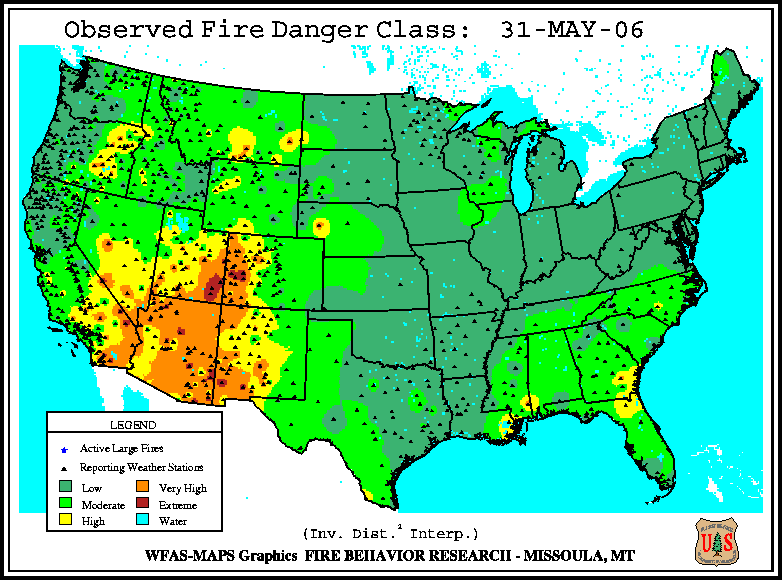
Dead fuel moisture levels were very dry at the end of May. The 10-hour fuel moisture levels on May 29th were extremely dry, with the observed levels below 5% across most of the High Plains, Great Basin, and Southwest states.
Medium to larger fuels (i.e. the May 31st 100-hr and May 31st 1000-hr fuel moistures) also remained unusually dry over the past month, especially in Arizona, New Mexico, western Texas, and the western slope of Colorado.
The Keetch-Byram Drought Index (KBDI), a widely used index for fire risk, had the largest potential for wildland fire activity in the contiguous U.S. across parts of the Southwest, southern Texas, and Florida at the end of May. In addition, the observed Experimental Fire Potential Index at the end of May was also anomalously high for a large area of the Southwest.
For further information on drought conditions across the U.S. please visit the May drought summary page.
|
2006 Wildfire Statistics
(from NIFC):
|
Totals as of early June |
Nationwide Number of
Fires |
Nationwide Number of
Acres Burned |
| 6/7/2006
|
44,186 |
2,647,575 |
| 6/7/2005 |
25,647 |
449,746 |
| 6/7/2004 |
32,789 |
564,973 |
| 6/7/2003 |
22,509 |
425,870 |
| 6/7/2002 |
32,541 |
1,270,443 |
| 6/7/2001 |
34,760 |
738,314 |
| 6/7/2000 |
43,713 |
1,190,304 |

Fire Danger Class map from 31 May 2006
|

Large fires - 27 April 2006

U.S. Drought Monitor map from 2 May 2006
|
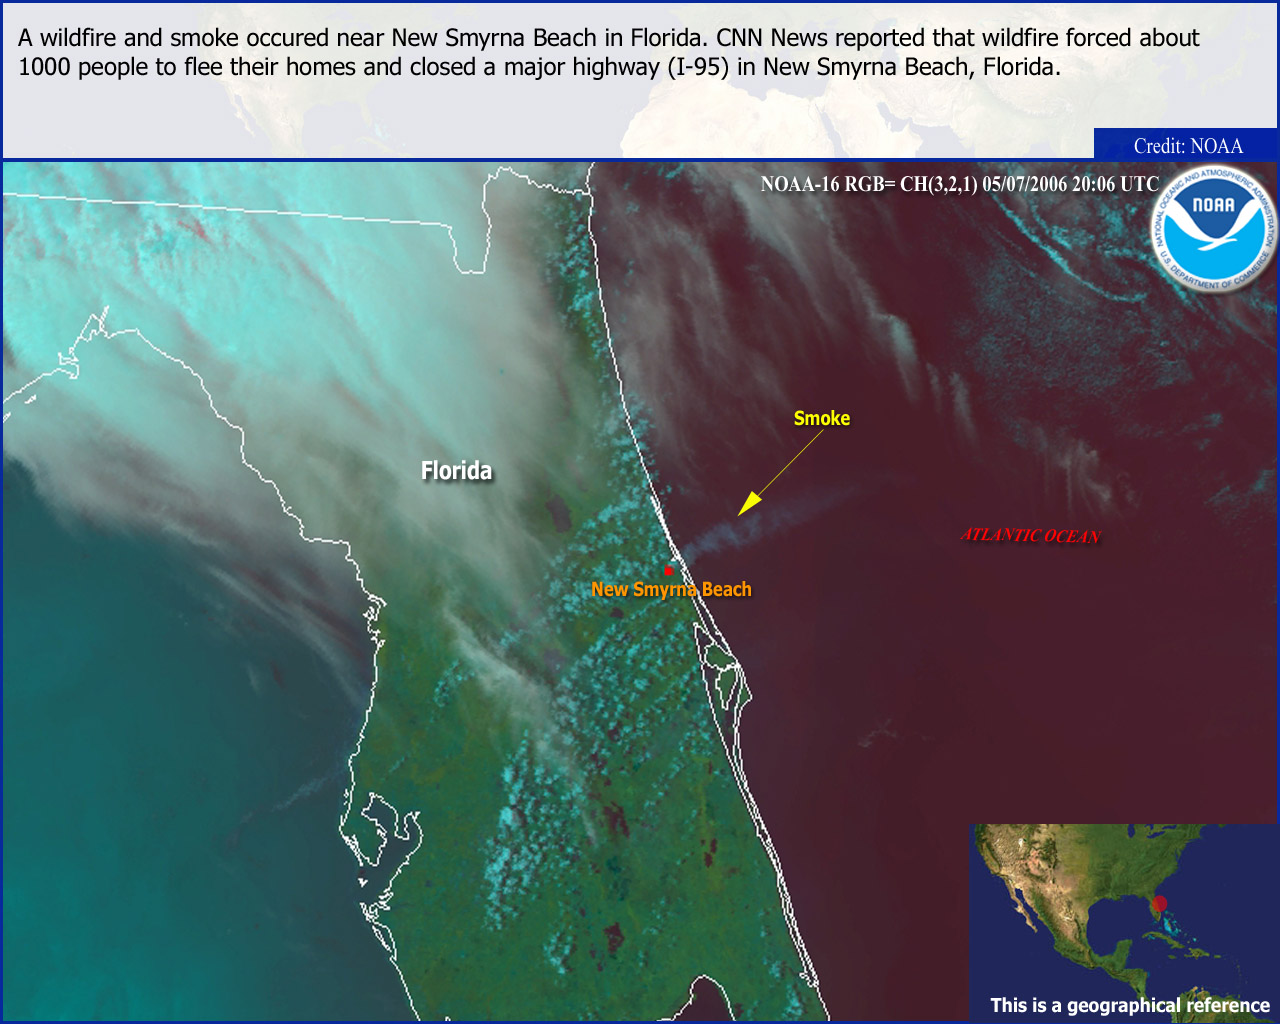
Wildland fire activity was above normal during April, which continued the anomalous activity since the beginning of 2006. Fires continued to affect parts of the southwest and southern U.S. during April, while wildfire activity developed in Florida in April and early May. The dramatic increase in fire activity in Florida over the past few weeks has subsequently spread statewide, threatening many homes and structures, and also impacting parts of the state with
smoke and reduced visibilties.
There have been over 37,000 wildland fires across the Lower 48 States since the beginning of 2006, with large fire activity focused in the central and southern Plains, the Southwest and the Florida peninsula. As of May 5th, over 2.3 million acres have burned across the U.S., according to estimates from the National Interagency Fire Center.
Of the total acreage, approximately 1.8 million acres have burned in the Southern Area (which encompasses 13 states, Puerto Rico, the Virgin Islands and the District of Columbia). Spring is typically a period when wildland fire activity begins to increase across the contiguous U.S., but both the number of fires and the acreage burned have been well above normal so far this year.
|
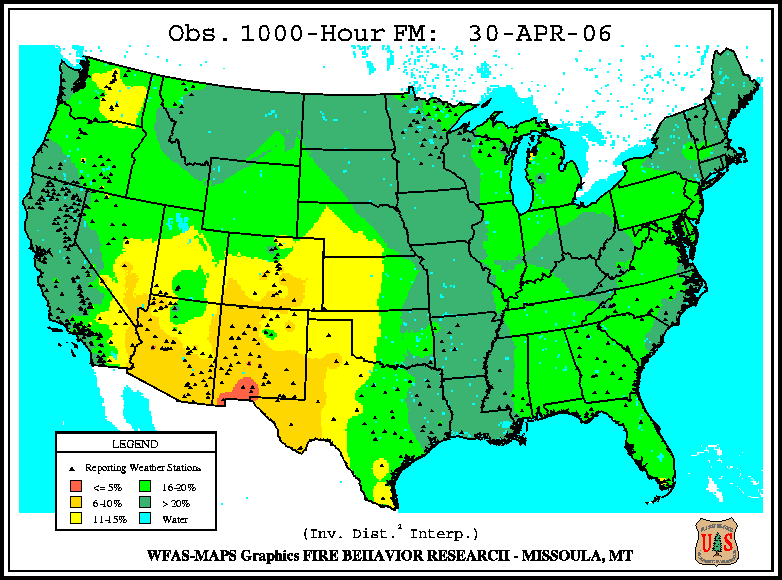
Dead fuel moisture levels remained very dry in April. The 10-hour fuel moisture levels on April 30th were extremely dry, with the observed levels below 5% across parts of the High Plains and Southwest states.
Medium to larger fuels (i.e. the April 30th 100-hr and April 30th 1000-hr fuel moistures) also remained unusually dry over the past month, especially across New Mexico, southern and western Texas, southeast Colorado, and western Oklahoma and Kansas.
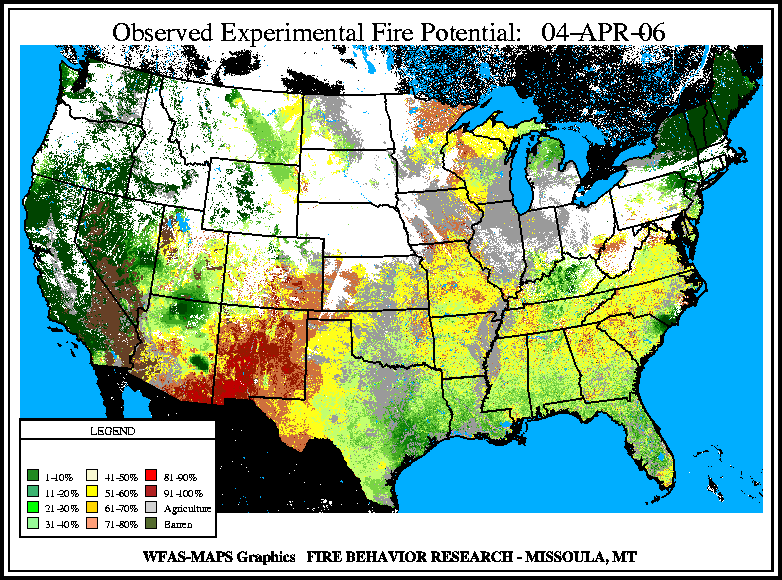
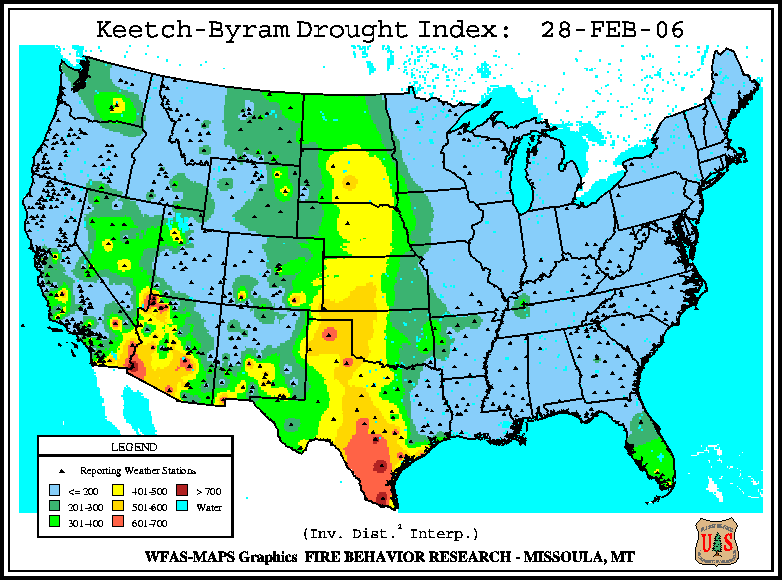
The Keetch-Byram Drought Index (KBDI), a widely used index for fire risk, had the largest potential for wildland fire activity in the contiguous U.S. across parts of the Southwest, southern Texas, and Florida at the end of April. In addition, the observed experimental fire potential index in early May was also anomalously high for a large area of the Southwest.
For further information on drought conditions across the U.S. go to the April drought summary page.
|
2006 Wildfire Statistics (from NIFC):
|
Totals as of early May |
Nationwide Number of
Fires |
Nationwide Number of
Acres Burned |
| 5/3/2006
|
36,087 |
2,291,025 |
| 5/3/2005 |
18,735 |
273,884 |
| 5/3/2004 |
24,856 |
377,000 |
| 5/3/2003 |
16,742 |
336,367 |
| 5/3/2002 |
24,421 |
442,575 |
| 5/3/2001 |
24,284 |
481,518 |
| 5/3/2000 |
29,606 |
750,256 |

Fire Danger Class map from 30 April 2006
|
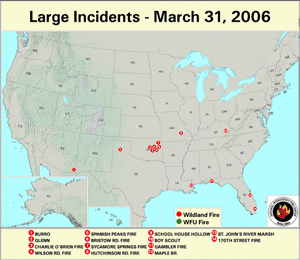
Large fires - 31 March 2006

Large fires - 7 April 2006
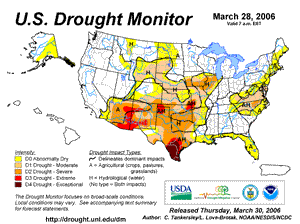
U.S. Drought Monitor map from 28 March 2006
|
Wildland fire activity remained much above normal during March, as numerous fires affected parts of the central and southern U.S. The outbreak of fires that had initially developed at the end of 2005 continued over the past month despite several short periods of relief. Fire activity recently spread to Florida in early April.
There have been over 22,000 fires across the lower 48 states since the beginning of 2006, with large fire activity primarily focused in the central and southern Plains (mainly in Texas and Oklahoma), the Southwest and the Florida peninsula. Over 1.8 million acres have burned across the contiguous U.S. so far this year, according to the most recent estimates from the National Interagency Fire Center, with approximately 1.5 million acres burned in the Southern Area (which encompasses 13 states, Puerto Rico, the Virgin Islands and the District of Columbia).
During March, anomalously dry weather continued across the southern Plains region, where long-term drought conditions have persisted over the past year. The winter and early spring is typically a period when wildland fire activity is relatively low across the contiguous U.S., but both the number of fires and the acreage burned have been anomalously large this year.
|
Dead fuel moisture levels were unusually dry during March. In early April, the 10-hour fuel moisture levels remained extremely dry, with the observed levels below 5% across parts of the Plains and Southwest states.
Medium to larger fuels (i.e. the March 31st 100-hr and March 31st 1000-hr fuel moistures) also remained unusually dry during March, especially across New Mexico, western Texas, southeast Colorado, and western Oklahoma and Kansas.
The Keetch-Byram Drought Index (KBDI), a widely used index for fire risk, had the largest potential for wildland fire activity in the contiguous U.S. across parts of the Southwest, southern Texas, and southern Florida at the end of March. In addition, the observed experimental fire potential index in early April was also anomalously high for a large area of the Southwest.
For further information on drought conditions across the U.S. go to the March drought summary page.
|
2006 Wildfire Statistics (from NIFC):
|
Totals as of early April |
Nationwide Number of
Fires |
Nationwide Number of
Acres Burned |
| 4/5/2006
|
22,564 |
1,872,701 |
| 4/5/2005 |
9,631 |
143,898 |
| 4/5/2004 |
15,577 |
171,677 |
| 4/5/2003 |
8,547 |
129,015 |
| 4/5/2002 |
16,060 |
266,383 |
| 4/4/2001 |
15,307 |
284,907 |
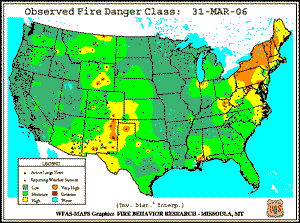
Fire Danger Class map from 31 March 2006
|
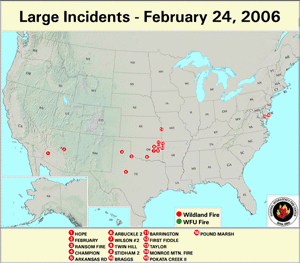
Large fires - 24 February 2006

Large fires - 3 March 2006

28 February 2006 U.S. Drought Monitor map
|
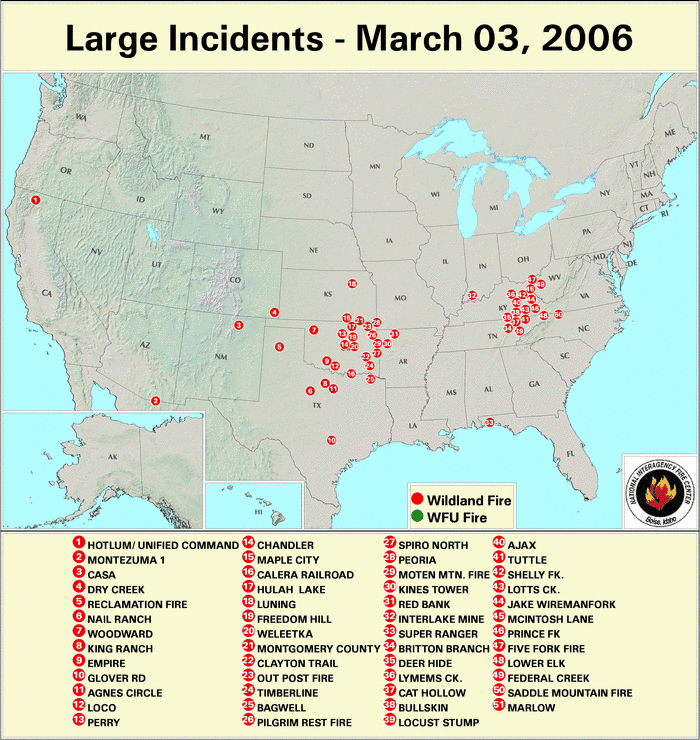
Wildfire activity continued to be much above normal during February. The outbreak of fires that had initially developed at the end of 2005 continued across parts of the central and southern U.S. over the past month. Since the beginning of 2006 there have been over 10,000 fires across the lower 48 states, with large fire activity primarily focused in the central and southern Plains and Southwest regions.
Anomalously dry weather continued across Oklahoma and Texas during February, where long-term drought conditions worsened during the first two months of 2006. In addition, fire activity spread to Tennessee, Kentucky, and North Carolina at the end of February and the beginning of March.
The National Interagency Fire Center's estimates that over 500,000 acres had burned across the U.S. by March 3rd, with over 380,000 acres in the southern Plains region alone. Both the number of fires and the burned acreage are unusually high for this time of year, which is typically a period when wildland fire activity is normally quite low across the U.S.
|
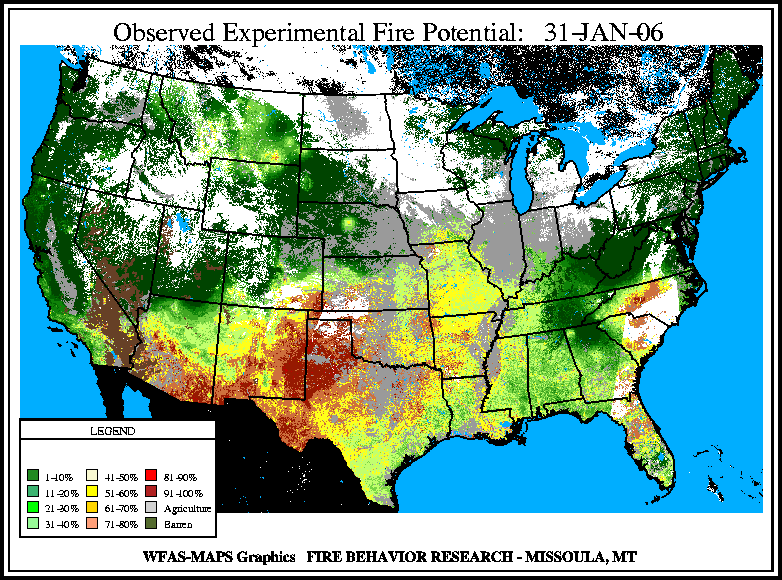
Dead fuel moisture levels across the southern and central Plains states decreased during February. Fine fuel moisture levels (i.e. 10-hour fuels) remained extremely dry, with levels below 5% across parts of the Plains states and most of the Southwest.
Medium to larger fuels (i.e. the February 28th 100-hr and February 28th 1000-hr fuel moistures) were also unusually dry for the winter, especially across most of the Southwest, Front Range and the southern Plains areas.
The Keetch-Byram Drought Index (KBDI), a widely used index for fire risk, had the largest potential for wildland fire activity in the contiguous U.S. across most of the central and southern Plains at the end of February. In addition, the observed experimental fire potential index was also anomalously high for a large area of the interior West for winter.
For further information on drought conditions across the U.S. go to the February drought summary page.
|
2006 Wildfire Statistics (from NIFC):
|
Totals as of early March |
Nationwide Number of
Fires |
Nationwide Number of
Acres Burned |
| 3/3/2006
|
7,943 |
457,110 |
| 3/4/2005 |
4,638 |
32,198 |
| 3/5/2004 |
6,236 |
72,276 |
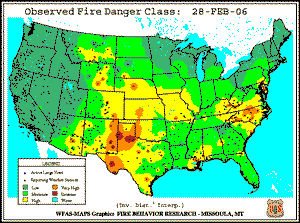
Fire Danger Class map from 28 February 2006
Experimental Fire Potential map from 6 March 2006
|
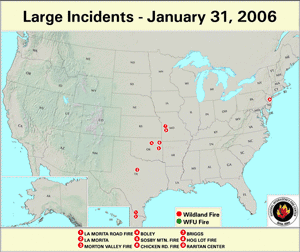
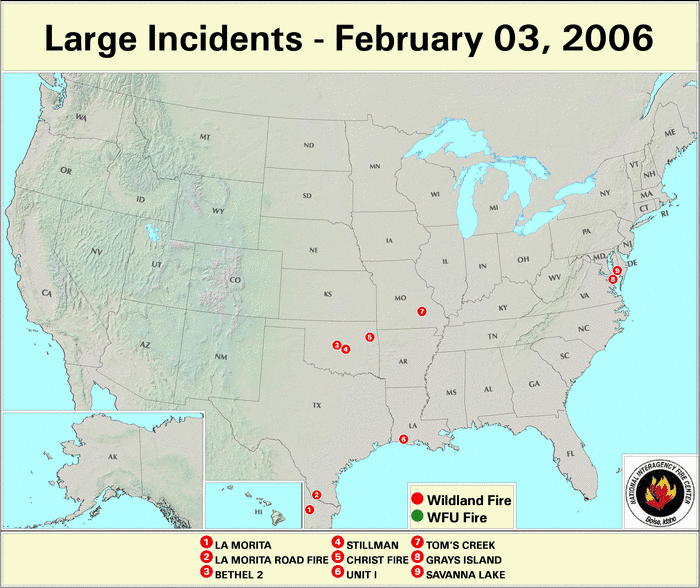
Large fires - 31 January 2006
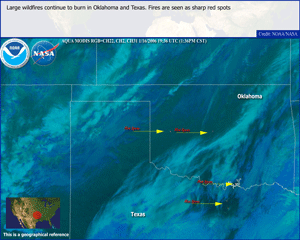
AVHRR image of TX and OK fires on 18 Jan. 2006
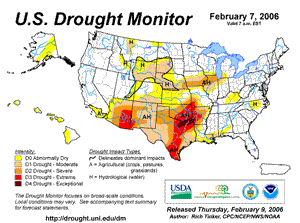
9 February 2006 U.S. Drought Monitor map
|
Wildfire activity that had initially developed at the end of 2005 continued across parts of the central and southern U.S. during January 2006. Over 3700 fires have occurred since the beginning of the year, with numerous large fires in the central and southern Plains region. Especially hard hit were Oklahoma and Texas, where long-term drought conditions worsened during the latter half of 2005, but fire activity also spread to the Southwest and Front Range regions later in the month. Several large fires continued to burn into early February 2006 in Texas, Oklahoma and Missouri.
Preliminary estimates from the National Interagency Fire Center suggest that over 330,000 acres had burned across the U.S. by the end of January, with over 260,000 acres in the southern Plains region. Fire activity during winter is normally low across the U.S., and both the number of fires and the burned acres are unusually large for this time of year.
At the end of January, fire activity developed across parts of Florida and southern Georgia. More recently, dry conditions combined with offshore Santa Ana winds have increased fire risk and activity across Southern California.
|
Dead fuel moisture levels across the southern and central Plains states decreased during January. In particular, fine fuel moisture levels (i.e. 10-hour fuels) were extremely dry, with levels below 5% across most of Texas and Oklahoma. Unusually dry fine fuels were also measured across parts of Kansas, Arizona and New Mexico at the end of the month.
Medium to larger fuels (i.e. the January 31st 100-hr and January 31st 1000-hr fuel moistures) were also unusually dry for the winter, especially across the Southwest, the Front Range and the southern Plains areas.
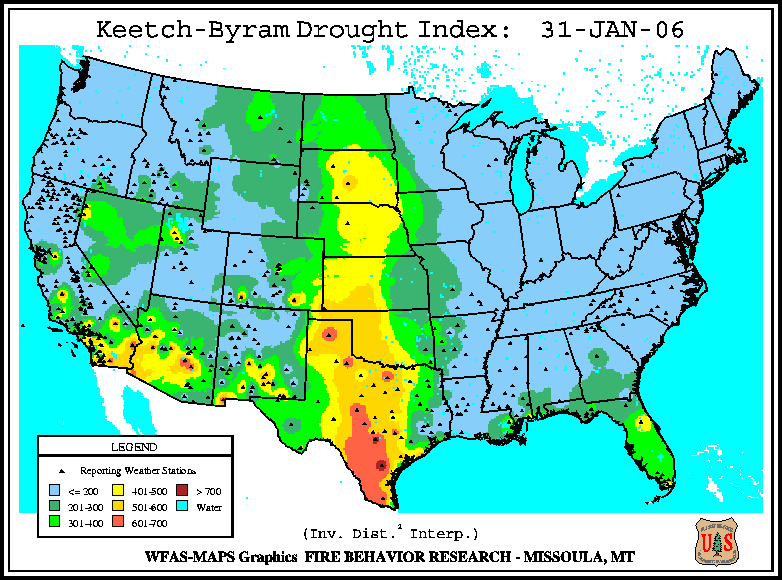
The Keetch-Byram Drought Index (KBDI), a widely used index for fire risk, had the largest potential for wildland fire activity in the contiguous U.S. across parts of the central and southern Plains at the end of January. In addition, the observed fire danger classification and experimental fire potential index were also anomalously high for the southern Plains region for winter.
For further information on drought conditions across the U.S. go to the January drought summary page.
|
2006 Wildfire Statistics (from NIFC):
|
Totals as of January 31st |
Nationwide Number of
Fires |
Nationwide Number of
Acres Burned |
| 2006
|
3,507 |
330,447 |
| 2005 |
505 |
1,620 |
| 2004 |
859 |
8,294 |

Fire Danger Class map from 31 January 2006

Experimental Fire Potential map from 31 January 2006
|
 Questions? Questions?
For all climate questions other than questions concerning this report, please contact the National Climatic Data Center's Climate Services Division:
Climate Services Division
NOAA/National Climatic Data Center
151 Patton Avenue
Asheville, NC 28801-5001
fax: 828-271-4876
phone: 828-271-4800
email: questions@ncdc.noaa.gov
|
For further information on the historical climate perspective presented in this report, contact:
David Levinson
NOAA/National Climatic Data Center
151 Patton Avenue
Asheville, NC 28801-5001
fax: 828-271-4328
email: David.Levinson@noaa.gov
|
-or-
Jay Lawrimore
NOAA/National Climatic Data Center
151 Patton Avenue
Asheville, NC 28801-5001
fax: 828-271-4328
email: Jay.Lawrimore@noaa.gov
|
/ Climate Monitoring / 2006 / Latest Monthly Report / Wildfires / Help
|


