|
January 12, 1999


Table 1.  PRECIPITATION AND TEMPERATURE RANKS, BASED
	  ON THE PERIOD 1895-1998.  1 = DRIEST/COLDEST,
	  104 = WETTEST/WARMEST FOR DECEMBER 1998,
	  104 = WETTEST/WARMEST FOR NOV-DEC 1998,
	  104 = WETTEST/WARMEST FOR JUL-DEC 1998,
	  104 = WETTEST/WARMEST FOR JAN-DEC 1998.

                                DEC    NOV-DEC    JUL-DEC    JAN-DEC
          REGION              1998     1998       1998       1998
           ------              ----  ---------  ---------  ---------

                     PRECIPITATION:

          NORTHEAST              7        2          3         73
          EAST NORTH CENTRAL    16       38         36         79
          CENTRAL               47       30         36         90

          SOUTHEAST             45       30         31         81
          WEST NORTH CENTRAL    62       91         96         96
          SOUTH                 54       59         92         64

          SOUTHWEST             19       22         69         70
          NORTHWEST             81       94         78         99
          WEST                  13       49         55        103

          NATIONAL              33       41         61        100

                     TEMPERATURE:

          NORTHEAST             99       95         98        104
          EAST NORTH CENTRAL    91       98        103        103
          CENTRAL               88       95        100        103

          SOUTHEAST             96      100        103        101
          WEST NORTH CENTRAL    73       90        102        100
          SOUTH                 68       93        102        101

          SOUTHWEST             62       79         93         87
          NORTHWEST             42       70        103        100
          WEST                  39       51         76         40

          NATIONAL              84      102        104        103

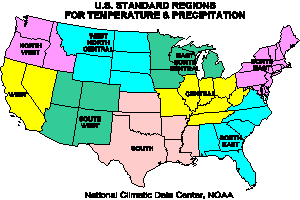
Table 2 shows the 1998 annual values, the annual extremes, and 1961-1990 annual normal precipitation and temperature for the 9 regions and the contiguous U.S. 
TABLE 2.  EXTREMES, 1961-90 NORMALS, AND 1998 VALUES
          FOR JANUARY-DECEMBER

            PRECIPITATION (INCHES)
                              DRIEST     WETTEST   NORMAL  1998
          REGION            VALUE YEAR VALUE YEAR   PCPN   PCPN
          ------            ---------- ----------  ------ ------

         NORTHEAST          31.77 1930 53.79 1996  41.63  42.54
         EAST NORTH CENTRAL 19.81 1910 36.63 1951  30.50  32.08
         CENTRAL            30.56 1930 53.38 1990  43.05  47.74

         SOUTHEAST          37.56 1954 62.39 1929  51.03  54.48
         WEST NORTH CENTRAL 11.49 1934 22.86 1915  16.92  19.90
         SOUTH              23.40 1917 46.91 1973  35.72  36.87

         SOUTHWEST           7.68 1956 22.10 1941  13.64  14.31
         NORTHWEST          19.00 1929 37.30 1996  27.50  32.81
         WEST                9.97 1947 31.47 1983  16.51  26.84

         NATIONAL           24.17 1910 33.99 1973  29.46  32.61*

                             * PRELIMINARY VALUE, CONFIDENCE
                               INTERVAL + OR -  .19 INCHES

                                TEMPERATURE (DEGREES F)
                              COLDEST    WARMEST   NORMAL  1998
          REGION            VALUE YEAR VALUE YEAR   TEMP   TEMP
          ------            ---------- ----------  ------ ------

         NORTHEAST           43.1 1904  49.3 1998   46.1   49.3
         EAST NORTH CENTRAL  39.5 1917  48.0 1931   43.5   47.7
         CENTRAL             50.6 1917  56.9 1921   53.2   56.3

         SOUTHEAST           61.0 1901  65.0 1921   62.4   64.7
         WEST NORTH CENTRAL  39.9 1916  46.7 1934   43.3   45.6
         SOUTH               60.4 1979  64.9 1921   62.0   64.5

         SOUTHWEST           49.5 1912  54.6 1934   51.8   52.8
         NORTHWEST           44.1 1955  50.2 1934   46.7   48.6
         WEST                53.0 1911  57.8 1934   55.0   54.6

         NATIONAL            50.7 1917  54.7 1934   52.4   54.6*

                             * PRELIMINARY VALUE, CONFIDENCE
                               INTERVAL + OR -  .0 DEG. F.

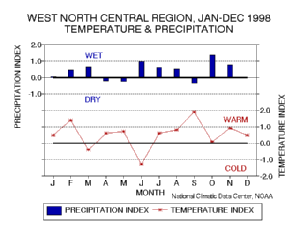
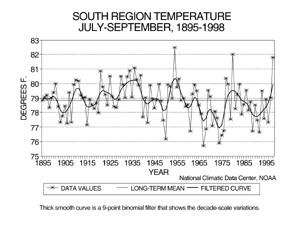
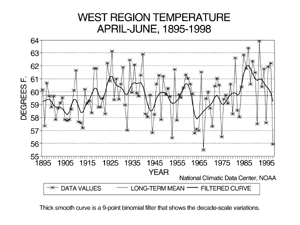
Considerable month-to-month variability in precipitation and temperature occurred during 1998. The following bar graphs show the January-December monthly precipitation and temperature anomalies for each of the 9 regions. The precipitation and temperature indices are expressed in terms of standard deviations from the norm: positive values are wet or warm, negative values are dry or cold.


For more information, refer to ... Thomas R. Karl and Albert J. Koscielny, 1982: "Drought in the United States: 1895-1981." Journal of Climatology, vol. 2, pp. 313-329. Thomas R. Karl and Walter James Koss, 1984: "Regional and National Monthly, Seasonal, and Annual Temperature Weighted by Area, 1895-1983." Historical Climatology Series 4-3, National Climatic Data Center, Asheville, NC, 38 pp. NOAA's National Climatic Data Center is the world's largest active archive of weather data. The preliminary temperature and precipitation rankings are available from the center by calling: 828-271-4800 or on the World Wide Web at: http:/www.ncdc.noaa.gov/ol/documentlibrary/cvb.html Historical precipitation and temperature ranking maps are also available on the Internet at: http://nic.fb4.noaa.gov/products/analysis_monitoring/regional_monitoring/usa.html. NOAA works closely with the academic and science communities on climate-related research projects to increase the understanding of El Niño and improve forecasting techniques. NOAA's Climate Prediction Center monitors, analyzes and predicts climate events ranging from weeks to seasons for the nation. NOAA also operates the network of data buoys and satellites that provide vital information about the ocean waters, and initiates research projects to improve future climate forecasts. The long lead climate outlooks are available on the Internet at: http://nic.fb4.noaa.gov.

For further information, contact:
NOAA/National Climatic Data Center 151 Patton Avenue Asheville, NC 28801-5001 fax: 828-271-4328 email: mchangry@ncdc.noaa.gov -or- NOAA/National Climatic Data Center 151 Patton Avenue Asheville, NC 28801-5001 fax: 828-271-4328 email: david.easterling@noaa.gov -or- NOAA/National Climatic Data Center 151 Patton Avenue Asheville, NC 28801-5001 fax: 828-271-4328 email: rquayle@ncdc.noaa.gov  NCDC /
Climate Resources /
Climate of 1998 /
Annual / U.S. Regional Analysis /
Search /
Help
http://www.ncdc.noaa.gov/oa/climate/research/1998/ann/us_regions_main.html Downloaded Sunday, 12-Oct-2008 22:33:58 EDT Last Updated Thursday, 17-Feb-2005 07:21:45 EST by matthew.menne@noaa.gov Please see the NCDC Contact Page if you have questions or comments. |


