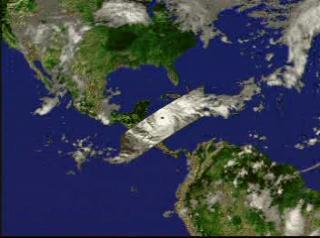
Hurricane Mitch from TRMM: October 27, 1998
|
|
|
|
A fly-in to Hurricane Mitch on October 27, 1998, showing the three-dimensional structure of the precipitation as measured by the Precipitation Radar instrument on TRMM. In this animation, a surface of constant precipitation is colored by the value of the precipitation on the ground under the surface.
Duration: 22.0 seconds
Available formats:
352x240 (29.97 fps)
MPEG-1
3 MB
320x238
JPEG
13 KB
How to play our movies
|
|
|
|
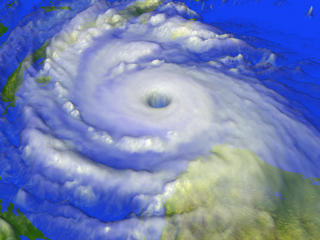
A three-dimensional view of the cloud structure of Hurricane Mitch
Available formats:
2560 x 1920
TIFF
3 MB
160 x 80
PNG
21 KB
320 x 240
JPEG
15 KB
80 x 40
PNG
6 KB
|
|
|
|
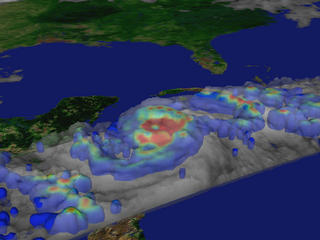
A perspective view of clouds and precipitation isosurfaces of Hurricane Mitch
Available formats:
2048 x 1536
TIFF
4 MB
320 x 240
JPEG
14 KB
|
|
|
|
Precipitation rates on the ground superimposed on an infrared cloud image of Hurricane Mitch, measured by TRMM on October 27, 1998. Red represents the regions of highest rainfall.
Available formats:
2048 x 1536
TIFF
2 MB
320 x 240
JPEG
20 KB
|
|

|
|
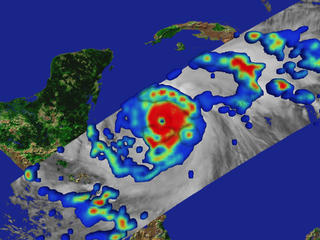
An infrared image of Hurricane Mitch superimposed on ground precipitation rates for Hurricane Mitch, from October 27, 1998. Red represents regions of highest rainfall.
Available formats:
2048 x 1536
TIFF
5 MB
320 x 240
JPEG
16 KB
|
|

|
|
An infrared image of Hurricane Mitch taken by the VIRS instrument on TRMM on October 27, 1998
Available formats:
1500 x 1000
GIF
383 KB
320 x 213
JPEG
6 KB
|
|
|
Back to Top
|

