NASA Satellite Reveals Heavy Rainfall Patterns in California
|
|
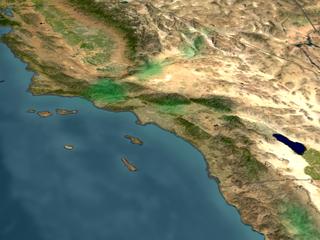
The collision of a flow of moisture from Hawaii known as a 'Pineapple Express' and a persistent low pressure system are wreaking havoc on California weather. This movie shows rain accumulation in San Diego from Jan. 6 through Jan. 11 based on data from the Tropical Rainfall Measuring Mission (TRMM)-based Multisatellite Precipitation Analysis. The accumulation is shown in colors ranging from green (less than 50 mm of rain) through red (200 mm or more). The TRMM satellite, using the world's only spaceborne rain radar and other microwave instruments, measures rainfall over the ocean. In this case instruments were able to reveal rainfall structure resulting from storms 'riding' the actual Pineapple Express extending toward Hawaii, which is beyond the range of conventional land-based National Weather Service radars. In early 1995, a Pineapple Express hit California, contributing to a season of winter storms that killed 27 people and did $3 billion in damages and costs. A Pineapple Express in mid-October 2003 wreaked havoc from south of Seattle to north of Vancouver Island. Flooding forced more than 3,000 people from their homes.
|
|

|
|
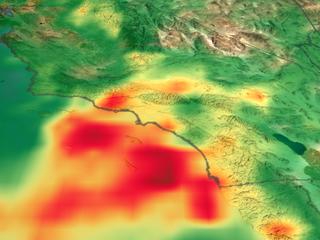
This movie shows how the rain accumulated over a 5 day period. Green shows areas up to 50 millimeters (~2 inches) and red shows areas up to 225 millimeters (~9 inches).
Duration: 24.0 seconds
Available formats:
720x486 (29.97 fps)
Frames
720x486 (29.97 fps)
Frames
640x480 (30 fps)
MPEG-1
7 MB
640x480 (30 fps)
MPEG-1
12 MB
320x240 (30 fps)
MPEG-1
3 MB
320x240 (30 fps)
MPEG-1
3 MB
320x240
JPEG
5 KB
320x240
JPEG
5 KB
How to play our movies
|
|

|
|
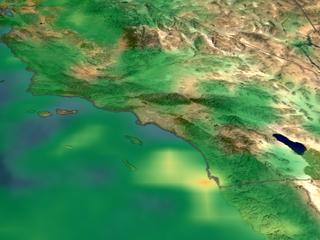
January 7, 2005 . This image shows 27 hours of accumulated rainfall. The accumulation is shown in colors ranging from green (less than 50 mm of rain) through red (200 mm or more).
Available formats:
2560 x 1920
TIFF
6 MB
160 x 80
PNG
26 KB
320 x 240
JPEG
14 KB
80 x 40
PNG
7 KB
|
|
|
|
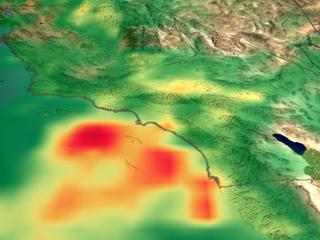
January 8, 2005 . This image shows 51 hours of accumulated rainfall. The accumulation is shown in colors ranging from green (less than 50 mm of rain) through red (200 mm or more).
Available formats:
2560 x 1920
TIFF
6 MB
160 x 80
PNG
26 KB
320 x 240
JPEG
13 KB
80 x 40
PNG
7 KB
|
|
|
|
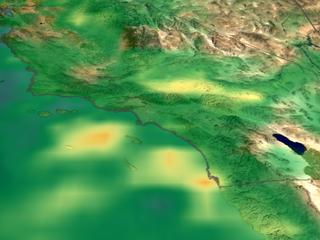
January 10, 2005 . This image shows 99 hours of accumulated rainfall. The accumulation is shown in colors ranging from green (less than 50 mm of rain) through red (200 mm or more).
Available formats:
2560 x 1920
TIFF
6 MB
160 x 80
PNG
24 KB
320 x 240
JPEG
13 KB
80 x 40
PNG
7 KB
|
|

|
|
January 11, 2005 . This image shows 123 hours of accumulated rainfall. The accumulation is shown in colors ranging from green (less than 50 mm of rain) through red (200 mm or more).
Available formats:
2560 x 1920
TIFF
6 MB
160 x 80
PNG
24 KB
320 x 240
JPEG
13 KB
80 x 40
PNG
7 KB
|
|
|
|
January 9, 2005 . This image shows 75 hours of accumulated rainfall. The accumulation is shown in colors ranging from green (less than 50 mm of rain) through red (200 mm or more).
Available formats:
2560 x 1920
TIFF
5 MB
160 x 80
PNG
25 KB
320 x 240
JPEG
12 KB
80 x 40
PNG
7 KB
|
|

|
|
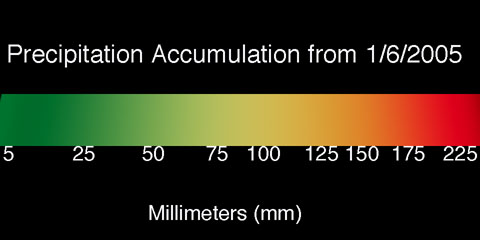
Color Table for accumulated rainfall. Green shows up to 50 millimeters (~2 inches) and red shows up to 225 millimeters (~9 inches).
Available formats:
960 x 480
TIFF
81 KB
960 x 480
JPEG
78 KB
480 x 240
JPEG
44 KB
160 x 80
PNG
22 KB
|
|
|
Back to Top
|

