|
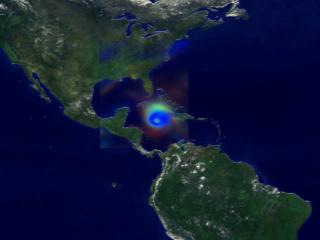
This animation illustrates the output of NASA's finite-volume General Circulation Model (fvGCM) during the five day period just prior to the landfall of hurricane Ivan. The data used for this animation was computed for each hour. The visible structure of the hurricane is defined by areas of high wind. The color represents the amount of total precipitable water (blue is low, red is high).
|

