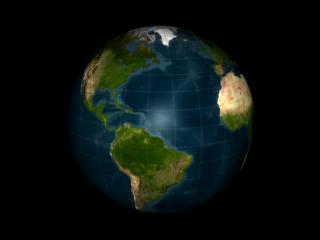
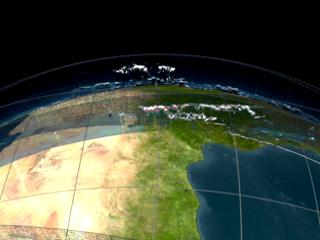
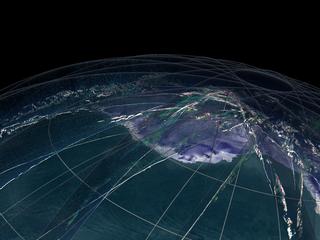
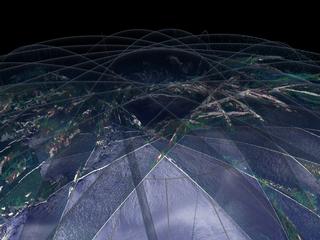
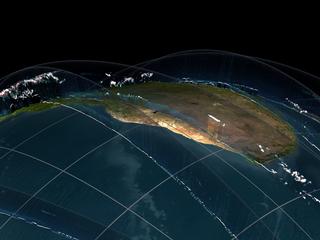
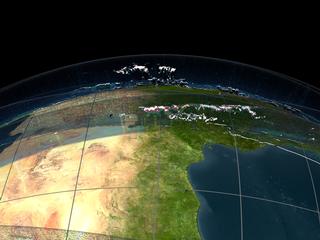
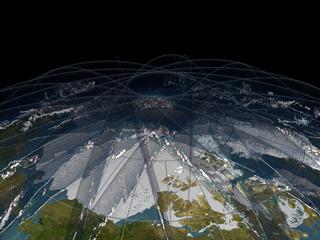
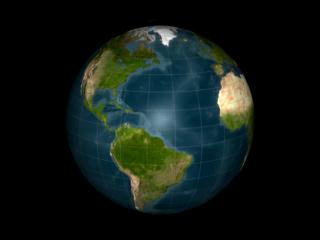
This is an animation showing data from ICESat's Geoscience Laser Altimeter System (GLAS). Cloud data can be seen over about 15 orbits on October 6, 2003. The data are initially laid out in the order that is was collected followed by continued movement around the scene. This version of the animation starts with the full globe, moves south to Antarctica, over the pole, then north to Africa, around the world near the equator and finally to the north pole.


