2005 Hurricanes: Clouds and Sea Surface Temperature
|
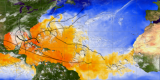
This visualization shows sea surface temperatures during most of the 2005 hurricane season. Overlaid are infrared cloud data, storm track data, and storm name labels. Warm ocean waters provide the heat energy that fuels hurricanes. Notice the correspondence between the storm tracks and the sea surface temperature response; this is particulary noticeable for hurricanes Dennis, Emily, and Katrina, where the hurricanes churn up the ocean so that cooler water rises to the surface. This version shows the entire Atlantic hurricane region and depicts all of the 2005 hurricanes except Zeta, which appeared at the very end of the year.
|
|

|
|
The 2005 hurricane season showing sea surface temperatures, clouds, and named storm tracks. Cloud data comes from GOES-12 and sea surface temperature comes from AMSR-E.
Duration: 31.0 seconds
Available formats:
1024x512
Frames
1024x512 (25 fps)
MPEG-1
15 MB
320x160
PNG
111 KB
160x80
PNG
31 KB
80x40
PNG
8 KB
1024x512 (25 fps)
MPEG-4
31 MB
How to play our movies
|
|
This product is available through our Web Map Service.
Click here to learn more.
|
|
|
|
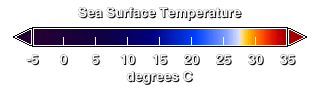
The legend for sea surface temperature. The color scale ranges from dark blue for areas below 15C to dark red for regions above 35C.
Available formats:
320 x 90
PNG
9 KB
|
|
|
Back to Top
|


