Montreal Adjustment - Phaseout Graph
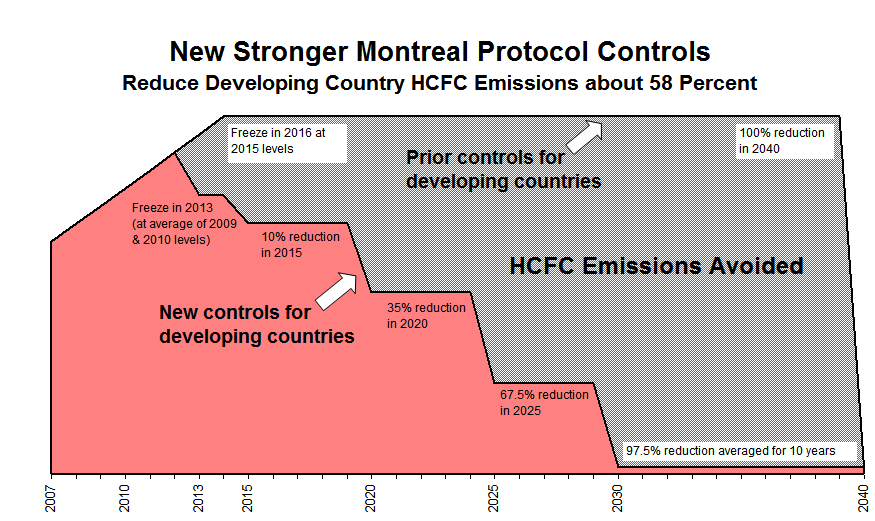
The HCFC reductions represented in the graph is the difference between the original phaseout schedule (where production level was frozen at 2015 levels until 2040) and the five new step-wise reductions between 2013 and 2040.