|
|
 |
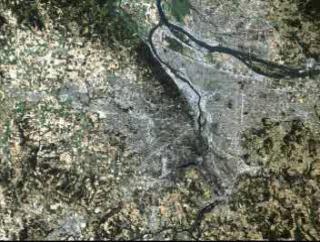
Urban Growth: Portland, Oregon
|
Using the Landsat satellite, scientists are able to study the urban sprawl of major cities. Red dots in these images indicate areas of growth between 1986 and 1996.
|
|
|
|
Starting with a view of Portland, Oregon, and its vicinity, with the boundary visible, we push in to the southern area and pan around the city moving clockwise, eventually pulling out to view the entire city again.
Duration: 1.7 minutes
Available formats:
352x240 (29.97 fps)
MPEG-1
14 MB
160x80
PNG
30 KB
80x40
PNG
7 KB
320x242
JPEG
24 KB
720x480 (29.97 fps)
MPEG-2
75 MB
720x480 (29.97 fps)
QUICKTIME
352 MB
How to play our movies
|
|

|
|
Video slate for this animation
Available formats:
720 x 528
JPEG
105 KB
320 x 234
PNG
334 KB
|
| Animation Number: | 1043 |
| Animator: | Stuart A. Snodgrass (Lead) |
| Studio: | NASA |
| Completed: | 2000-02-21 |
| Scientist: | Jeffrey Masek (University of Maryland) |
| Instruments: | Landsat
|
| | Landsat-7/ETM+ |
| Data Collected: | 1986, 1996 |
| Series: | AAAS |
| Video: | SVS2000-0002 * |
Keywords:
DLESE
>> Human geography
SVS
>> Sprawl
SVS
>> Urban
SVS
>> Washington DC
|
More Information on this topic available at:
stories/AAAS/index.html
|
|
Please give credit for this item to
NASA/Goddard Space Flight Center
Scientific Visualization Studio |
*Please note: the SVS does not fulfill requests for copies of the tapes in our library. On some of our animation pages, there is a direct link to a video distribution service from which tapes, handled by the Public Affairs Office (PAO)/Goddard TV, including some of our animations may be ordered. General information on this service can be found here. |
|
Back to Top
|
|
|
|

