|
|
 |
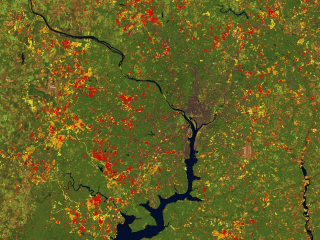
Growth of Washington D.C. Metro Area: Alternate Color Scheme
|
1973 - 1985 = Red; 1985 - 1990 = Orange; 1990 - 1996 = Yellow
|
|

|
|
Urban growth of Washington, D.C. and its suburbs from 1973 to 1996.
Duration: 21.0 seconds
Available formats:
320x240 (10 fps)
QUICKTIME
1 MB
352x240 (29.97 fps)
MPEG-1
2 MB
320x240
JPEG
9 KB
160x80
PNG
19 KB
80x40
PNG
5 KB
320x238
JPEG
9 KB
How to play our movies
|
|
|
|
Urban growth of Washington, D.C. and suburbs
Available formats:
640 x 480
JPEG
400 KB
1280 x 960
TIFF
3 MB
80 x 40
PNG
6 KB
2560 x 1920
TIFF
14 MB
320 x 240
GIF
77 KB
|
| Animation Number: | 895 |
| Animator: | Jesse Allen (Lead) |
| Studio: | NASA |
| Completed: | 1999-04-09 |
| Scientist: | Jeffrey Masek (University of Maryland) |
| Instrument: | Landsat |
| Data Collected: | 1973-1996 |
| Series: | Urban Growth |
| Video: | SVS1999-1003 * |
Keywords:
DLESE
>> Ecology
DLESE
>> Human geography
DLESE
>> Physical geography
SVS
>> Washington DC
|
More Information on this topic available at:
stories/Landsat/dc_growth.html
|
|
Please give credit for this item to
NASA/Goddard Space Flight Center
Scientific Visualization Studio |
*Please note: the SVS does not fulfill requests for copies of the tapes in our library. On some of our animation pages, there is a direct link to a video distribution service from which tapes, handled by the Public Affairs Office (PAO)/Goddard TV, including some of our animations may be ordered. General information on this service can be found here. |
|
Back to Top
|
|
|
|

