|
|
 |
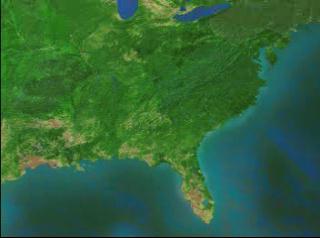
3D Atlanta Heat Island
|
Zoom in showing true color, then changing to daytime thermal, then nighttime thermal, using mountain top, Landsat, ATLAS thermal, land use, and clouds/convection data
|
|
|
|
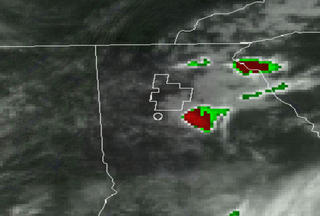
A flyby of Atlanta showing visible imagery, daytime thermal data, and nighttime thermal data taken by an airborne ATLAS instrument on May 11 and 12, 1997. This imagery is surrounded by Landsat Thematic Mapper data taken on June 27, 1998. The flyby is followed by a timelapse of land use in the region from 1973 to 1997 from Landsat data and a sequence of GOES imagery showing cloud and thunderstorm formation over the Atlanta heat island.
Duration: 1.2 minutes
Available formats:
320x240 (10 fps)
QUICKTIME
3 MB
352x240 (29.97 fps)
MPEG-1
9 MB
160x80
PNG
20 KB
80x40
PNG
5 KB
320x238
JPEG
10 KB
720x480 (29.97 fps)
MPEG-2
52 MB
720x480 (29.97 fps)
QUICKTIME
250 MB
How to play our movies
|
|
|
|
Convection over Atlanta
Available formats:
1728 x 1166
JPEG
135 KB
576 x 389
JPEG
26 KB
2880 x 1944
TIFF
16 MB
320 x 216
JPEG
11 KB
80 x 40
PNG
5 KB
|
|
|
|
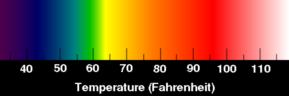
Temperature scale for Atlanta Heat Island
Available formats:
482 x 160
TIFF
226 KB
289 x 96
JPEG
4 KB
|
|

|
|
Video slate for this animation
Available formats:
720 x 528
JPEG
127 KB
320 x 234
PNG
341 KB
|
| Animation Number: | 1049 |
| Animators: | Greg Shirah (Lead) |
| | Tom Bridgman |
| Studio: | NASA |
| Completed: | 2000-02-21 |
| Scientist: | Dale Quattrochi (NASA/MSFC) |
| Instruments: | ATLAS
|
| | GOES |
| | Landsat |
| | Landsat-5/TM |
| Data Collected: | ATLAS: 1997/05/11-1997/05/12, Landsat: 1973, 1979, 1983, 1987, 1992, 1997, 1998/06/27 |
| Series: | AAAS |
| Video: | SVS2000-0002 * |
| Goddard TV Tape: | G2000-015 |
Keywords:
SVS
>> Atlanta
SVS
>> Heat Island
DLESE
>> Human geography
SVS
>> Sprawl
SVS
>> Urban
|
More Information on this topic available at:
stories/AAAS/index.html
|
|
Please give credit for this item to
NASA/Goddard Space Flight Center
Scientific Visualization Studio |
*Please note: the SVS does not fulfill requests for copies of the tapes in our library. On some of our animation pages, there is a direct link to a video distribution service from which tapes, handled by the Public Affairs Office (PAO)/Goddard TV, including some of our animations may be ordered. General information on this service can be found here. |
|
Back to Top
|
|
|
|

