Hurricane Katrina Sea Surface Temperature
|
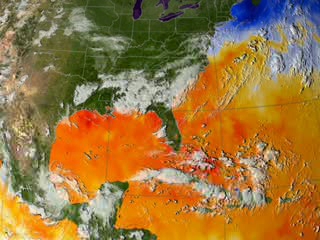
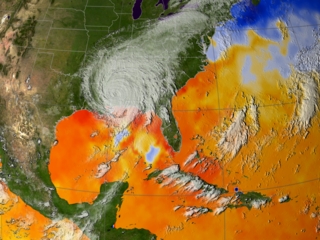
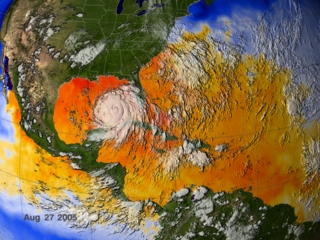
This visualization shows the cold water trail left by Hurricane Katrina. The data is from August 23 through 30, 2005. The colors on the ocean represent the sea surface temperatures, and satellite images of the hurricane clouds are laid over the temperatures to clearly show the hurricane positions. Orange and red depict regions that are 82 degrees F and higher, where the ocean is warm enough for hurricanes to form. Hurricane winds are sustained by the heat energy of the ocean, so the ocean is cooled as the hurricane passes and the energy is extracted to power the winds. The sea surface temperatures are 3-day moving averages based on the AMSR-E instrument on the Aqua satellite, while the cloud images were taken by the Imager on the GOES-12 satellite.
|
|
|
|
Sea surface temperature with cloud overlay
Duration: 18.0 seconds
Available formats:
320x240 (30 fps)
MPEG-1
1 MB
640x480 (30 fps)
MPEG-1
6 MB
720x480 (29.97 fps)
MPEG-2
10 MB
320x240
JPEG
49 KB
1280x720 (29.97 fps)
MPEG-2
40 MB
1280x720 (30 fps)
Frames
720x486
Frames (Sst)
How to play our movies
|
|

|
|
Dates overlay (with alpha) corresponding to Hurricane Katrina sea surface temperatures
Available formats:
720x486
Frames (Dates)
320x216
PNG
2 KB
How to play our movies
|
|
|
|
Sea surface temperature showing Hurricane Katrina's cold water wake in blues (08-29-2005)
Available formats:
320 x 240
JPEG
73 KB
2560 x 1920
TIFF
10 MB
80 x 40
PNG
7 KB
160 x 80
PNG
27 KB
5100 x 3825
TIFF
31 MB
|
|
|
|
Sea surface temperature showing Hurricane Katrina's cold water wake in blues (08-27-2005)
Available formats:
2560 x 1920
TIFF
16 MB
320 x 240
JPEG
80 KB
|
|
|
|
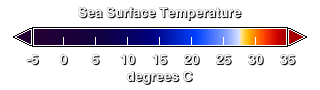
Color bar for sea surface temperatures (blue=15 degrees C, white= 27.7 degrees C, red=30+ degrees C)
Available formats:
320 x 90
TIFF
11 KB
320 x 90
PNG
1016 B
|
|
|
Back to Top
|

