|
|
 |
Net Radiation Flux Compared to Clouds (WMS)
|
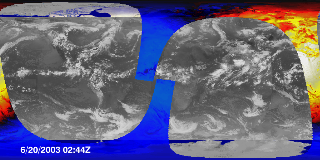
The Earth's climate is determined by energy transfer from the sun to the Earth's land, oceans, and atmosphere. As the Earth rotates, the sun lights up only part of the Earth at a time, and some of that incoming solar energy is reflected and some is absorbed, depending on type of area it lights. The amount of reflection and absorption is critical to the climate. An instrument named CERES orbits the Earth every 99 minutes and measures the reflected solar energy. This animation shows the net radiation flux within view of CERES during 29 orbits on June 20 and 21 of 2003. The net flux is the incoming solar flux minus the outgoing reflected (shortwave) and thermal (longwave) radiation. If the flux in a region is positive, the Earth is being warmed by the sun in that region, while cooling regions have a negative flux. It is clear from the animation that the most intensive heating occurs in ocean regions with few clouds, while the second most intense are cloud-free regions over vegetated land areas. Deserts, cloudy regions, and ice caps all reflect enough solar radiation to reduce the amount of heating. Regions of night are, of course, cooling regions because there is no incoming flux at all.
|
|
|
|
This animation shows net radiation flux corresponding to 29 orbits (2 days) of CERES measurements, from June 20-21, 2003. This data is calculated from CERES outgoing longwave and shortwave measurements, along with a corresponding calculated incoming solar flux. The measurements are superimposed over a global infrared cloud cover composite from the same period.
Duration: 29.0 seconds
Available formats:
640x320 (29.97 fps)
MPEG-1
5 MB
320x160
PNG
73 KB
160x80
PNG
21 KB
80x40
PNG
6 KB
1024x512
Frames
How to play our movies
|
|
This product is available through our Web Map Service.
Click here to learn more.
|
|
|
|
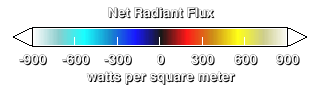
This is the legend for the net radiation flux animation, indicating the magnitudes of total incoming or outgoing energy flux.
Available formats:
320 x 90
PNG
1 KB
|
|
|
Back to Top
|
|
|
|


