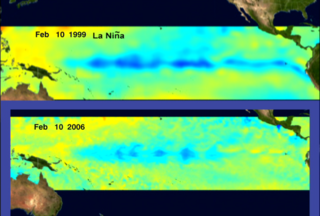
Comparing the 1998-1999 La Nina event to the corresponding 2006 Sea Surface Temperature Anomaly Conditions
|
Are we seeing another La Nina event in 2006? This animation compares the winter 1998-1999 La Nina event to the corresponding 2006 conditions in the Pacific Ocean. This is done by comparing Sea Surface Temperature (SST) anomalies (i.e., differences from normal SST values) between 1999 and 2006. Blue areas indicate ocean regions 5 degrees Celsius (9 degrees Fahrenheit) cooler than the norm. During the 1998-1999 La Nina event this resulted in a distinct area of deep blue stretching across the Pacific Ocean. Through this comparison, one can see that our current ocean temperature conditions do not reflect those same conditions during the 1998-1999 La Nina event.
|
|
|
|
Example animation comparing Sea Surface Temperature Anomaly conditions during the 1998-1999 La Nina event on February 10, 1999 to SST Anomalies on February 10, 2006.
Duration: 29.0 seconds
Available formats:
720x486 (29.97 fps)
Frames (Dates)
720x486 (29.97 fps)
Frames (Sst anomalies)
720x480 (29.97 fps)
MPEG-2
25 MB
640x480 (30 fps)
MPEG-1
19 MB
320x240 (30 fps)
MPEG-1
5 MB
720x486 (29.97 fps)
Frames (Example animation)
320x216
PNG
290 KB
How to play our movies
|
|
|
|
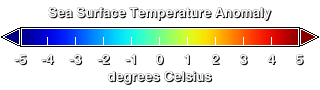
Color bar showing temperature anomalies ranging from 5 degrees Celsius (9 Farenheit) hotter (red areas) to 5 C (9 F) cooler (blue areas).
Available formats:
320 x 90
PNG
12 KB
|
|

|
|
SST anomalies derived from NOAA-14/AVHRR SST data. This data is a 10 day average spanning 2/1/99 to 2/10/99 which was collected during the 1998-1999 La Nina event. An earlier animation of this La Nina event can be seen here.
Available formats:
2560 x 1920
TIFF
3 MB
320 x 240
PNG
74 KB
160 x 80
PNG
15 KB
80 x 40
PNG
4 KB
|
|
|
|
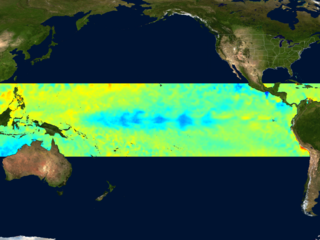
SST anomalies derived from Aqua/AMSR-E SST measurements. This data is a 10 day average spanning 2/1/06 to 2/10/06.
Available formats:
2560 x 1920
TIFF
3 MB
320 x 240
PNG
80 KB
160 x 80
PNG
16 KB
80 x 40
PNG
5 KB
|
|
|
Back to Top
|

