|
|
 |
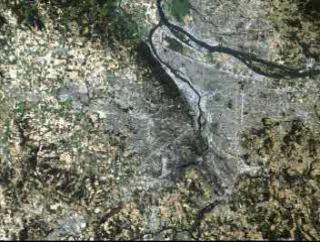
Urban Growth: Focusing on the Columbia River Region of Portland, Oregon
|
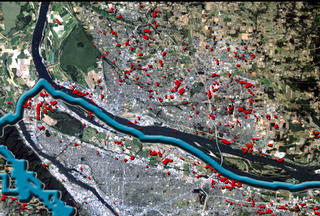
Using the Landsat satellite, scientists are able to study the urban sprawl of major cities. Red dots in these images indicate areas of growth between 1986 and 1996.
|
|
|
|
Starting with a view of the Portland, Oregon, vicinity, we push in to the north-eastern section, along the Columbia River. Red dots appear showing the areas where growth has occurred between 1986 and 1996.
Duration: 19.0 seconds
Available formats:
352x240 (29.97 fps)
MPEG-1
2 MB
160x80
PNG
30 KB
80x40
PNG
7 KB
320x242
JPEG
24 KB
How to play our movies
|
|
|
|
Red dots indicate areas of growth in the Portland, Oregon, and Vancouver, Washington, area.
Available formats:
2880 x 1944
TIFF
16 MB
160 x 80
PNG
32 KB
320 x 216
JPEG
33 KB
80 x 40
PNG
8 KB
|
| Animation Number: | 1044 |
| Animator: | Stuart A. Snodgrass (Lead) |
| Studio: | NASA |
| Completed: | 2000-02-21 |
| Scientist: | Jeffrey Masek (University of Maryland) |
| Instruments: | Landsat
|
| | Landsat-7/ETM+ |
| Data Collected: | 1986, 1996 |
| Series: | AAAS |
| Video: | SVS2000-0002 * |
Keywords:
DLESE
>> Human geography
SVS
>> Sprawl
SVS
>> Urban
SVS
>> Washington DC
|
More Information on this topic available at:
stories/AAAS/index.html
|
|
Please give credit for this item to
NASA/Goddard Space Flight Center
Scientific Visualization Studio |
*Please note: the SVS does not fulfill requests for copies of the tapes in our library. On some of our animation pages, there is a direct link to a video distribution service from which tapes, handled by the Public Affairs Office (PAO)/Goddard TV, including some of our animations may be ordered. General information on this service can be found here. |
|
Back to Top
|
|
|
|

