Recipe of a Hurricane (Part 1) - Sea Surface Temperature
|
|
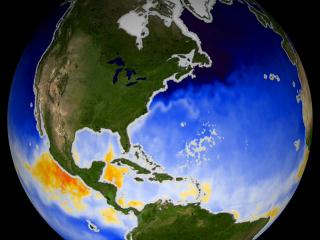
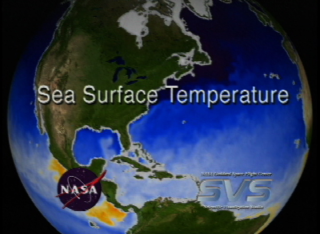
This visualization was created in support of the 'Recipe for a Hurricane' live shot campaign. This visualization shows sea surface temperature as measured by the NASA Aqua satellite's Advanced Microwave Scanning Radiometer (AMSR-E) instrument. Temperature is represented by the colors in the ocean. Orange and red indicate the necessary 82-degree and warmer sea surface temperatures for a hurricane to form. This version keeps the camera focused on the east coast of North America.
|
|
|
|
This visualization shows sea surface temperature as measured by the NASA Aqua satellite's Advanced Microwave Scanning Radiometer (AMSR-E) instrument. Temperature is represented by the colors in the ocean. Orange and red indicate the necessary 82-degree and warmer sea surface temperatures for a hurricane to form.
Duration: 23.0 seconds
Available formats:
720x486 (29.97 fps)
Frames
640x480 (30 fps)
MPEG-1
12 MB
720x480 (29.97 fps)
MPEG-2
20 MB
320x240 (30 fps)
MPEG-1
3 MB
320x240
JPEG
14 KB
80x40
PNG
12 KB
160x80
PNG
47 KB
720x480 (29.97 fps)
DV
107 MB
How to play our movies
|
|
|
|
None
Available formats:
720 x 528
JPEG
122 KB
320 x 234
PNG
361 KB
|
| Animation Number: | 2817 |
| Animators: | Greg Shirah (SVS) (Lead) |
| | Jesse Allen (SVS) |
| Completed: | 2003-09-26 |
| Scientist: | Jeff Halverson (JCET UMBC) |
| Instrument: | Aqua/AMSR-E |
| Data Collected: | 2002/06/02-2003/01/22 |
| Series: | Hurricane Live shots |
| Video: | SVS2003-0020 * |
| Goddard TV Tape: | G2003-051 |
Keywords:
SVS
>> Hurricane
|
|
Please give credit for this item to
NASA/Goddard Space Flight Center
Scientific Visualization Studio |
*Please note: the SVS does not fulfill requests for copies of the tapes in our library. On some of our animation pages, there is a direct link to a video distribution service from which tapes, handled by the Public Affairs Office (PAO)/Goddard TV, including some of our animations may be ordered. General information on this service can be found here. |
|
Back to Top
|

