Hurricane Katrina Rain Accumulation (WMS)
|
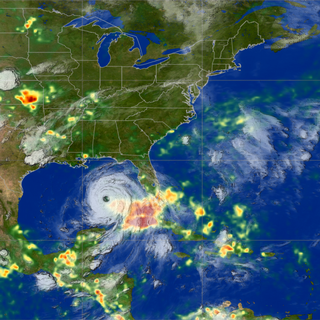
This animation shows rain accumulation from Hurricane Katrina from August 23 through 30, 2005 based on data from the Tropical Rainfall Measuring Mission (TRMM) Multisatellite Precipitation Analysis. Satellite cloud data from NOAA/GOES is overlaid for context. The accumulation is shown in colors ranging from green (less than 30 mm of rain) through red (80 mm or more). The TRMM satellite, using the world's only spaceborne rain radar and other microwave instruments, measures rainfall over the ocean.
|
|
|
|
GOES-12 infrared imagery over TRMM rainfall accumulation for Hurricane Katrina, from August 23, 2005 to August 30, 2005.
Duration: 9.0 seconds
Available formats:
512x512 (29.97 fps)
MPEG-1
2 MB
320x320
PNG
202 KB
160x80
PNG
27 KB
80x40
PNG
7 KB
1024x1024
Frames
How to play our movies
|
|
This product is available through our Web Map Service.
Click here to learn more.
|
|
|
|
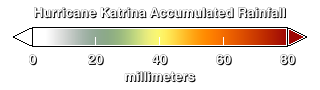
The legend for rainfall accumulation.
Available formats:
320 x 90
PNG
1 KB
|
|
|
Back to Top
|


