Sea Surface Temperature, Clouds, and Tropical Depression/Storm/Hurricane Tracks from June 1, 2005 to August 29, 2005
|
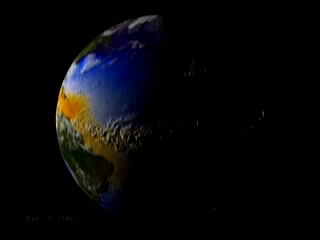
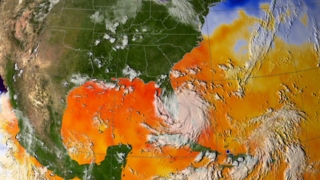
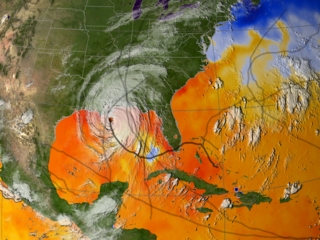
This visualization shows sea surface temperatures during the early part of the 2005 hurricane season. Overlaid are infrared cloud data and storm track data. Ocean temperatures are the fuel that drive hurricanes. Notice the correspondence between the storm tracks and the sea surface temperature response; this is particulary noticeable for hurricanes Dennis, Emily, and Katrina.
|
|
|
|
Sea surface temperature with clouds and storm tracks overlaid showing the first half of the 2005 hurricane season
Duration: 1.4 minutes
Available formats:
720x480 (29.97 fps)
MPEG-2
62 MB
640x480 (29.97 fps)
MPEG-1
31 MB
320x240 (29.97 fps)
MPEG-1
30 MB
320x240
JPEG
13 KB
1280x720 (29.97 fps)
MPEG-2
176 MB
1280x720 (30 fps)
Frames (Sst goes tracksHD)
720x480
Frames (Sst goes tracks)
How to play our movies
|
|
|
|
Sea surface temperature with clouds overlaid showing the first half of the 2005 hurricane season (no storm tracks)
Duration: 1.4 minutes
Available formats:
1280x720 (29.97 fps)
MPEG-2
176 MB
1280x720 (30 fps)
Frames (Sst goes noTracksHD)
720x486
Frames (Sst goes noTracks)
320x180
JPEG
59 KB
160x80
PNG
37 KB
80x40
PNG
9 KB
How to play our movies
|
|

|
|
Overlay frames (with alpha) of Katrina's storm track
Available formats:
720x486
Frames (TracksKatrina 24fpd)
320x216
PNG
1 KB
How to play our movies
|
|

|
|
Overlay frames (with alpha) of storm tracks up to Katrina (not including Katrina)
Available formats:
720x486
Frames (TracksNoKatrina 24fpd)
320x216
PNG
9 KB
How to play our movies
|
|

|
|
Sea surface temperature with clouds and tracks on Aug 29, 2005
Available formats:
2560 x 1920
TIFF
10 MB
320 x 240
JPEG
74 KB
80 x 40
PNG
8 KB
160 x 80
PNG
31 KB
|
|
|
|
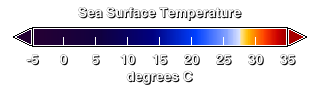
Sea surface temperature color bar (blue is about 20 degrees C and less, red is about 30 degrees C and higher)
Available formats:
320 x 90
TIFF
11 KB
320 x 90
PNG
1016 B
|
|
|
Back to Top
|

