Skip all navigation and jump to content Jump to site navigation Jump to section navigation.
NASA Logo - Goddard Space Flight Center + Visit NASA.gov
HOME PROJECTS RESOURCES SEARCH MAP

+ Advanced Search
Home
Home
View Most Recently Released Imagery
View Gallery of Imagery: A topical collection of SVS Imagery
Search Imagery by the keywords assigned to it
Search Imagery by the instruments that supplied data for a visualization product
Search Imagery by the series of visualizations that have been produced
Search Imagery by the scientist providing the data used in a visualization product
Search Imagery by the animator that created the product
Search Imagery by the identification number assigned to the visualization product
See other search options
Learn about the SVS Image Server
  + About the Server
  + Animation List
  + How to Use the Server


  + RSS Feeds
  + Podcasts


  + Opportunities
blank image
Previous Animation
Next Animation
NASA Explains 'Dust Bowl' Drought

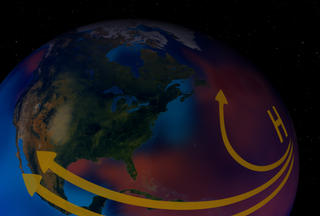
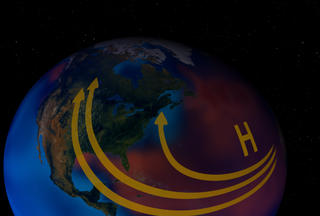
This illustration shows how cooler than normal tropical Pacific Ocean temperatures (blues) and warmer than normal tropical Atlantic Ocean temperatures (red and orange) contributed to a weakened low level jet stream and changed its course.

The jet stream normally flows westward over the Gulf of Mexico and then turns northward pulling up moisture and dumping rain onto the Great Plains. During the 1930s, this low level jet stream weakened, carrying less moisture, and shifted further south. The Great Plains land dried up and dust storms blew across the U.S.


This is the standard definition version Dust Bowl Climate Conceptual animaiton MPEG.    This is the standard definition version Dust Bowl Climate Conceptual animaiton MPEG.
Duration: 10.0 seconds
Available formats:
  320x240 (30 fps) MPEG-1   1 MB
  320x240     JPEG         11 KB
  720x486     Frames
  720x480 (29.97 fps) MPEG-2   4 MB
  640x480 (29.97 fps) MPEG-4   3 MB
  320x240 (30 fps) X-FLV       549 KB
How to play our movies


This is the high resolution still illustrating abnormal climate during Dust Bowl in the 1930's.    This is the high resolution still illustrating abnormal climate during Dust Bowl in the 1930's.

Available formats:
  3000 x 2025     TIFF 5 MB
  150 x 101         JPEG       3 KB
  320 x 216         JPEG     10 KB
  75 x 50             JPEG       1 KB


This is the high resolution still illustrating the normal climate of the region.    This is the high resolution still illustrating the normal climate of the region.

Available formats:
  3000 x 2025     TIFF 4 MB
  320 x 216         JPEG     10 KB

Animation Number:10033
Completed:2004-03-18
Animator:Susan Twardy (HTSI) (Lead)
Scientist:Siegfried D. Schubert (NASA/GSFC)
Writer:Rani Chohan (NASA/GSFC)
Goddard TV Tape:G2004-020
Keywords:
SVS >> Byrne
SVS >> Drought
SVS >> Earth Science
SVS >> Gonnelli
SVS >> Precipitation
SVS >> Sea Surface Temperature
 
 
Please give credit for this item to
NASA/Goddard Space Flight Center Conceptual Image Lab


Back to Top

USA.gov logo - the U.S. Government's official Web portal. + Privacy Policy and Important Notices
+ Reproduction Guidelines
NASA NASA Official:
Content Contact:
Curator: