|
|
 |
Multisensor Fire Observations without Labels
|
|
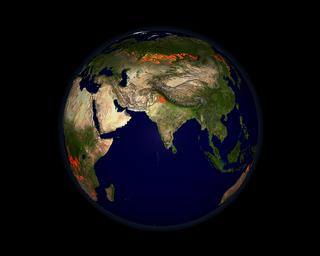
From space, we can understand fires in ways that are impossible from the ground. New Earth-observing satellites capture the significant impact of fires on our planet. In this animation of fires around the globe in 2002, each red dot marks a new fire. Dots change color to yellow after a few days and to black when fires burn out. From brush fires in Africa to forest fires in North America, satellites are locating every significant fire on Earth to within one kilometer. In the summer and fall burning seasons, particularly destructive fires occurred in Colorado, Arizona, and Oregon. This animation of remote sensing observations of fires and other related data was chosen as part of the SIGGRAPH 2003 Computer Animation Theater. (The only difference was that the SIGGRAPH version had shorter credits.)
|
|

|
|
The full 5 minute multisensor fire animation with audio and without annotations
Duration: 5.5 minutes
Available formats:
720x480 (29.97 fps)
Frames
512x288 (29.97 fps)
MPEG-1
103 MB
720x480 (29.97 fps)
MPEG-2
286 MB
256x144 (29.97 fps)
MPEG-1
47 MB
160x80
PNG
12 KB
320x177
JPEG
8 KB
80x40
PNG
3 KB
320x177
JPEG
8 KB
320x177
JPEG
8 KB
Audio Track
How to play our movies
|
|

|
|
A global view of fire incidence on May 5, 2002, as seen by the MODIS instrument on the Terra satellite. Red dots represent new fires, orange dots represent fires a day or so old, and gray dots represent old fires several days old.
Available formats:
1500 x 1200
TIFF
1 MB
320 x 256
JPEG
7 KB
|
|

|
|
A global view of fire incidence on July 5, 2002, as seen by the MODIS instrument on the Terra satellite. Red dots represent new fires, orange dots represent fires a day or so old, and gray dots represent old fires several days old.
Available formats:
853 x 480
TIFF
339 KB
320 x 180
JPEG
6 KB
|
|

|
|
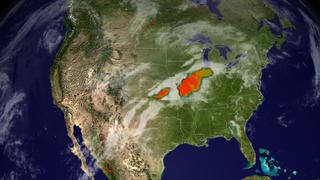
A view of fire incidence in the United States on June 21, 2002, as seen by the MODIS instrument on the Terra satellite. The big red region in Arizona is the Rodeo-Chediski fire and the red region in the center of Colorado is the Hayman fire.
Available formats:
853 x 480
TIFF
645 KB
320 x 180
JPEG
9 KB
|
|

|
|
A view of fire incidence in the United States on July 5, 2002, as seen by the MODIS instrument on the Terra satellite. Both the Rodeo-Chediski and Hayman fires are gone by this date.
Available formats:
853 x 480
TIFF
652 KB
320 x 180
JPEG
9 KB
|
|
|
|
A view of fire incidence in the United States on May 12, 2002, as seen by the MODIS instrument on the Terra satellite. Superimposed over the fires are cloud data in white from GOES and precipitation data in orange and yellow from TRMM.
Available formats:
853 x 480
TIFF
725 KB
320 x 180
JPEG
11 KB
|
|

|
|
A view of fire incidence in the United States on June 19, 2002, as seen by the MODIS instrument on the Terra satellite. Superimposed over the fires are cloud data in white from GOES and aerosol data in brown from Earth Probe TOMS. The Hayman fire is visible as a red region in central Colorado.
Available formats:
853 x 480
TIFF
717 KB
320 x 180
JPEG
11 KB
|
|
|
|
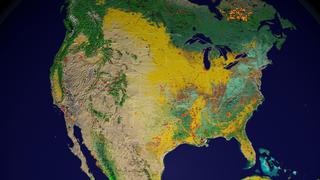
A view of fire incidence in the United States on July 14, 2002, as seen by the MODIS instrument on the Terra satellite. The fires are superimposed over landcover data from MODIS, where regions of different landcover characteristic are represented by different colors. The Biscuit fire is visible on the western end of the California-Oregon border.
Available formats:
853 x 480
TIFF
732 KB
320 x 180
JPEG
10 KB
|
|
|
|
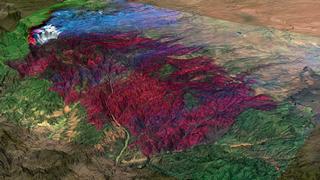
A view of the region around Denver, Colorado, on June 9, 2002, during the Hayman fire. Both the reddish image and the 3D smoke plume are measurements from the MISR instrument on Terra. The Hayman fire is located at the leftmost end of the smoke plume. The regions in purple are regions of large population density, and Denver is right underneath the right end of the plume.
Available formats:
853 x 480
TIFF
735 KB
320 x 180
JPEG
12 KB
|
|

|
|
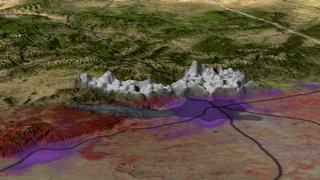
A view of the region around Denver, Colorado, on June 9, 2002, during the Hayman fire. The 3D smoke plume is a measurement from the MISR instrument on Terra, and the Hayman fire is located at the leftmost end of the smoke plume. The colored regions on the terrain are regions of differing landcover type, with magenta representing urban areas.
Available formats:
853 x 480
TIFF
948 KB
320 x 180
JPEG
16 KB
|
|

|
|
Fire incidence data for the Rodeo-Chediski fire in central Arizona on June 21, 2002, as measured by MODIS. Red regions are new fire areas, while orange and gray areas are successively older fires.
Available formats:
853 x 480
TIFF
864 KB
320 x 180
JPEG
15 KB
|
|
|
|
Landsat imagery for the Rodeo-Chediski fire in central Arizona on June 21, 2002. The imagery is enhanced with thermal data to bring out the fire regions.
Available formats:
853 x 480
TIFF
969 KB
320 x 180
JPEG
14 KB
|
|
|
|
Landsat imagery for the Rodeo-Chediski fire in central Arizona on June 29, 2002, after the fires have merged into a single fire. The imagery is enhanced with thermal data to bring out the fire regions.
Available formats:
853 x 480
TIFF
980 KB
320 x 180
JPEG
13 KB
|
|

|
|
Fire incidence for Nevada and California on July 13, 2002, as measured by MODIS. Purple regions represent regions of large population density.
Available formats:
853 x 480
TIFF
773 KB
320 x 180
JPEG
13 KB
|
|

|
|
Fire incidence for the Biscuit Fire in southern Oregon on July 29, 2002, as measured by MODIS. Purple regions represent regions of large population density, and the fire data is superimposed over MODIS imagery of the smoke being blown to the west from the fires.
Available formats:
853 x 480
TIFF
785 KB
320 x 180
JPEG
13 KB
|
|
|
|
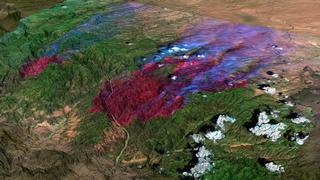
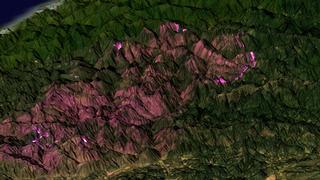
High resolution thermal data for the Biscuit Fire measured on August 14, 2002, by the ASTER instrument on the Terra satellite. Bright purple regions represent currently active fire regions, while dark purple regions are older burned areas.
Available formats:
853 x 480
TIFF
943 KB
320 x 180
JPEG
14 KB
|
|

|
|
Fire incidence data for the Biscuit Fire, as measured on August 20, 2002, by MODIS. The fire data is superimposed on land cover data from MODIS illustrating that the fire region is almost all one land cover type, evergreen needleleaf (in green), except for some small urban areas (in magenta).
Available formats:
853 x 480
TIFF
823 KB
320 x 180
JPEG
13 KB
|
|

|
|
Fire incidence data over North America on September 12, 2002, as measured by MODIS, shown with near surface ocean wind velocity vectors over the Pacific Ocean, as measred by the SeaWinds instrument on QuickSCAT.
Available formats:
853 x 480
TIFF
391 KB
320 x 180
JPEG
9 KB
|
|
|
|
Full Animation Credits:
Designed by
ESDIS Science Operations Office
Earth Science Data and Information Systems
NASA Goddard Space Flight Center
William C. North, NASA Goddard Space Flight Center
Jennifer Farnham, Global Science & Technology, Inc.
Dr. Fred J. Gunther, Computer Sciences Corporation
Dr. Brian Krupp, Global Science & Technology, Inc.
Rosemarie Slaughter, Computer Sciences Corporation
Produced by
Scientific Visualization Studio
NASA Goddard Space Flight Center
http://svs.gsfc.nasa.gov
Directed by
Dr. Horace Mitchell, NASA Goddard Space Flight Center
Lead Animator
Cynthia Starr, Global Science & Technology, Inc.
Contributors
Randall Jones, Global Science & Technology, Inc.
Alex Kekesi, Global Science & Technology, Inc.
Kevin Mahoney, Computer Sciences Corporation
Marte Newcombe, Global Science & Technology, Inc.
Lori Perkins, NASA Goddard Space Flight Center
Gregory Shirah, NASA Goddard Space Flight Center
Eric Sokolowsky, Global Science & Technology, Inc.
James W. Williams, Global Science & Technology, Inc.
Written by
Jarrett Cohen, Global Science & Technology, Inc.
Narrated by
Michael Starobin, Honeywell Technology Solutions, Inc.
Edited by
Stuart A. Snodgrass, Global Science & Technology, Inc.
Narration Recorded by
Fred Kemman, Honeywell Technology Solutions, Inc.
Music
"Sarabande - Earth Connection"
by
Robert Hitz, pianist/composer
Fire location data courtesy of the
MODIS Land Rapid Response Project
NASA Goddard Space Flight Center
and the
University of Maryland
Chris Justice, University of Maryland
Ed Masuoka, NASA Goddard Space Flight Center
Louis Giglio, Science Systems and Applications, Inc.
Jacques Descloitres, Science Systems and Applications, Inc.
Robert Sohlberg, University of Maryland
Missy Crisologo, University of Maryland
Blue Marble MODIS data composite courtesy of
MODIS Science Team
NASA Goddard Space Flight Center
and the
NASA Earth Observatory
Reto Stockli, Science Systems and Applications, Inc.
Topography data courtesy of
United States Geological Survey
Cloud data courtesy of
National Oceanic and Atmospheric Administration
Population data courtesy of
Socioeconomic Data and Applications Center
All other data courtesy of
NASA
NASA EOSDIS and other EOSDIS data distributed by NASA's
Distributed Active Archive Center (DAAC) Alliance
http://nasadaacs.eos.nasa.gov
Sponsored by
ESDIS Science Operations Office
Earth Science Data and Information Systems
NASA Goddard Space Flight Center
Vanessa L. Griffin, Manager
|
Back to Top
|
|
|
|

