Tropical Cyclone Climatology
The Atlantic hurricane season runs from June 1st to November 30th, and the Eastern Pacific
hurricane season runs from May 15th to November 30th. The Atlantic basin includes the
Atlantic Ocean, Caribbean Sea, and Gulf of Mexico. The Eastern Pacific basin extends to
140°W.
The following figures and tables describe the progress of a typical
hurricane season in terms of the total number of tropical systems and
hurricanes produced throughout the year in the Atlantic and East
Pacific basins.
In the figures, curves represent the average cumulative production of
all named tropical systems, all hurricanes, and those hurricanes which
were Category 3 or stronger in those
basins.
For example, by the beginning of September in an average year we would
expect to have had four named systems, two of which would be
hurricanes and one of which would be of category 3 or greater in
strength.
The tables list benchmark dates when a given number of tropical
systems, hurricanes, or category 3 storms should have been generated.
![[graph of average cumulative number of Atlantic basin systems per year]](https://webarchive.library.unt.edu/eot2008/20080916062319im_/http://www.nhc.noaa.gov/gifs/pastprofileAT_sm.gif) Figure 1.The average cumulative number of Atlantic systems per year
Figure 1.The average cumulative number of Atlantic systems per year |
![[graph of average cumulative number of Eastern Pacific basin systems per year]](https://webarchive.library.unt.edu/eot2008/20080916062319im_/http://www.nhc.noaa.gov/gifs/pastprofileEP_sm.gif) Figure 2.The average cumulative number of Eastern Pacific systems per year
Figure 2.The average cumulative number of Eastern Pacific systems per year
|
Table 1. Progress of the average Atlantic season
(1944-2005). Date upon which the following number of events
would normally have occurred.
| Number |
Named systems |
Hurricanes |
Category 3 or greater |
| 1 | July 10 | Aug 14 | Sep 3 |
| 2 | Aug 6 | Aug 30 | Sep 25 |
| 3 | Aug 20 | Sep 9 | - |
| 4 | Aug 29 | Sep 22 | - |
| 5 | Sep 5 | Oct 10 | - |
| 6 | Sep 12 | Nov 17 | - |
| 7 | Sep 20 | - | - |
| 8 | Sep 30 | - | - |
| 9 | Oct 12 | - | - |
| 10 | Nov 3 | - | - |
Table 2. Progress of the average eastern Pacific season
(1966-1996). Date upon which the following number of events
would normally have occurred.
| Number |
Named systems |
Hurricanes |
Category 3 or greater |
| 1 | June 9 | June 24 | July 19 |
| 2 | June 23 | July 13 | Aug 23 |
| 3 | July 3 | July 29 | Sep 19 |
| 4 | July 13 | Aug 12 | Oct 29 |
| 5 | July 20 | Aug 25 | - |
| 6 | July 28 | Sep 5 | - |
| 7 | Aug 5 | Sep 17 | - |
| 8 | Aug 14 | Oct 2 | - |
| 9 | Aug 21 | Oct 25 | - |
| 10 | Aug 28 | - | - |
| 11 | Sep 5 | - | - |
| 12 | Sep 13 | - | - |
| 13 | Sep 21 | - | - |
| 14 | Sep 30 | - | - |
| 15 | Oct 9 | - | - |
| 16 | Oct 27 | - | - |
Number of Tropical Cyclones per 100 Years
The official hurricane season for the Atlantic Basin (the Atlantic Ocean, the Caribbean Sea, and the Gulf of Mexico) is from 1 June to 30 November.
As seen in the graph above, the peak of the season is from mid-August to late October. However, deadly hurricanes can occur anytime in the
hurricane season.
(Source: http://hurricanes.noaa.gov/prepare/season.htm)
Tropical Cyclone Return Periods
Hurricane return periods are the frequency at which a certain intensity or category of hurricane
can be expected within 75 nm (86 statute miles) of a given location. In simpler terms, a return
period of 20 years for a Category 3 or greater hurricane means that on average during the previous
100 years, a Category 3 or greater hurricane passed within 75 nm (86 miles) of that location about
five times. We would then expect, on average, an additional five Category 3 or greater hurricanes
within that radius over the next 100 years.
Our Return Periods webpage has both images and PDF documents
that show the average return for Category 1, 2, 3, 4, and 5 hurricanes for selected coastal locations.
This data is produced by the National Hurricane Center Risk Analysis Program (HURISK) by Charles Neumann.
The basic idea is that a population of tropical cyclones falling within the 65 nm (75 miles) circle is
obtained from the best-track file. For that set of storms, the maximum wind within the circle is found.
Then, a count is conducted to find how many systems had winds of 30-34 kt, 35-39 kt etc. Once the count
is known, a function is used to "fit" the distribution. Since there are only a few intense tropical
cyclones typically in the 100-year record for a particular site, the mathematical function helps to
smooth this out and "fill in the holes" so to speak. The smooth function is then used to estimate the
number of systems that would occur over a longer time period. We would expect that if we actually had a
much longer historical record (several centuries) that the number of extreme events (i.e., category 5
hurricanes) observed would roughly match our estimates based on the shorter period of record.
Climatological Areas of Origin and Typical Hurricane Tracks by Month
The figures below show the zones of origin and tracks for different months during the hurricane season. These figures only depict average
conditions. Hurricanes can originate in different locations and travel much different paths from the average. Nonetheless, having a sense
of the general pattern can give you a better picture of the average hurricane season for your area.
(Source: http://hurricanes.noaa.gov/prepare/season_zones.htm)
Other Climatology Figures
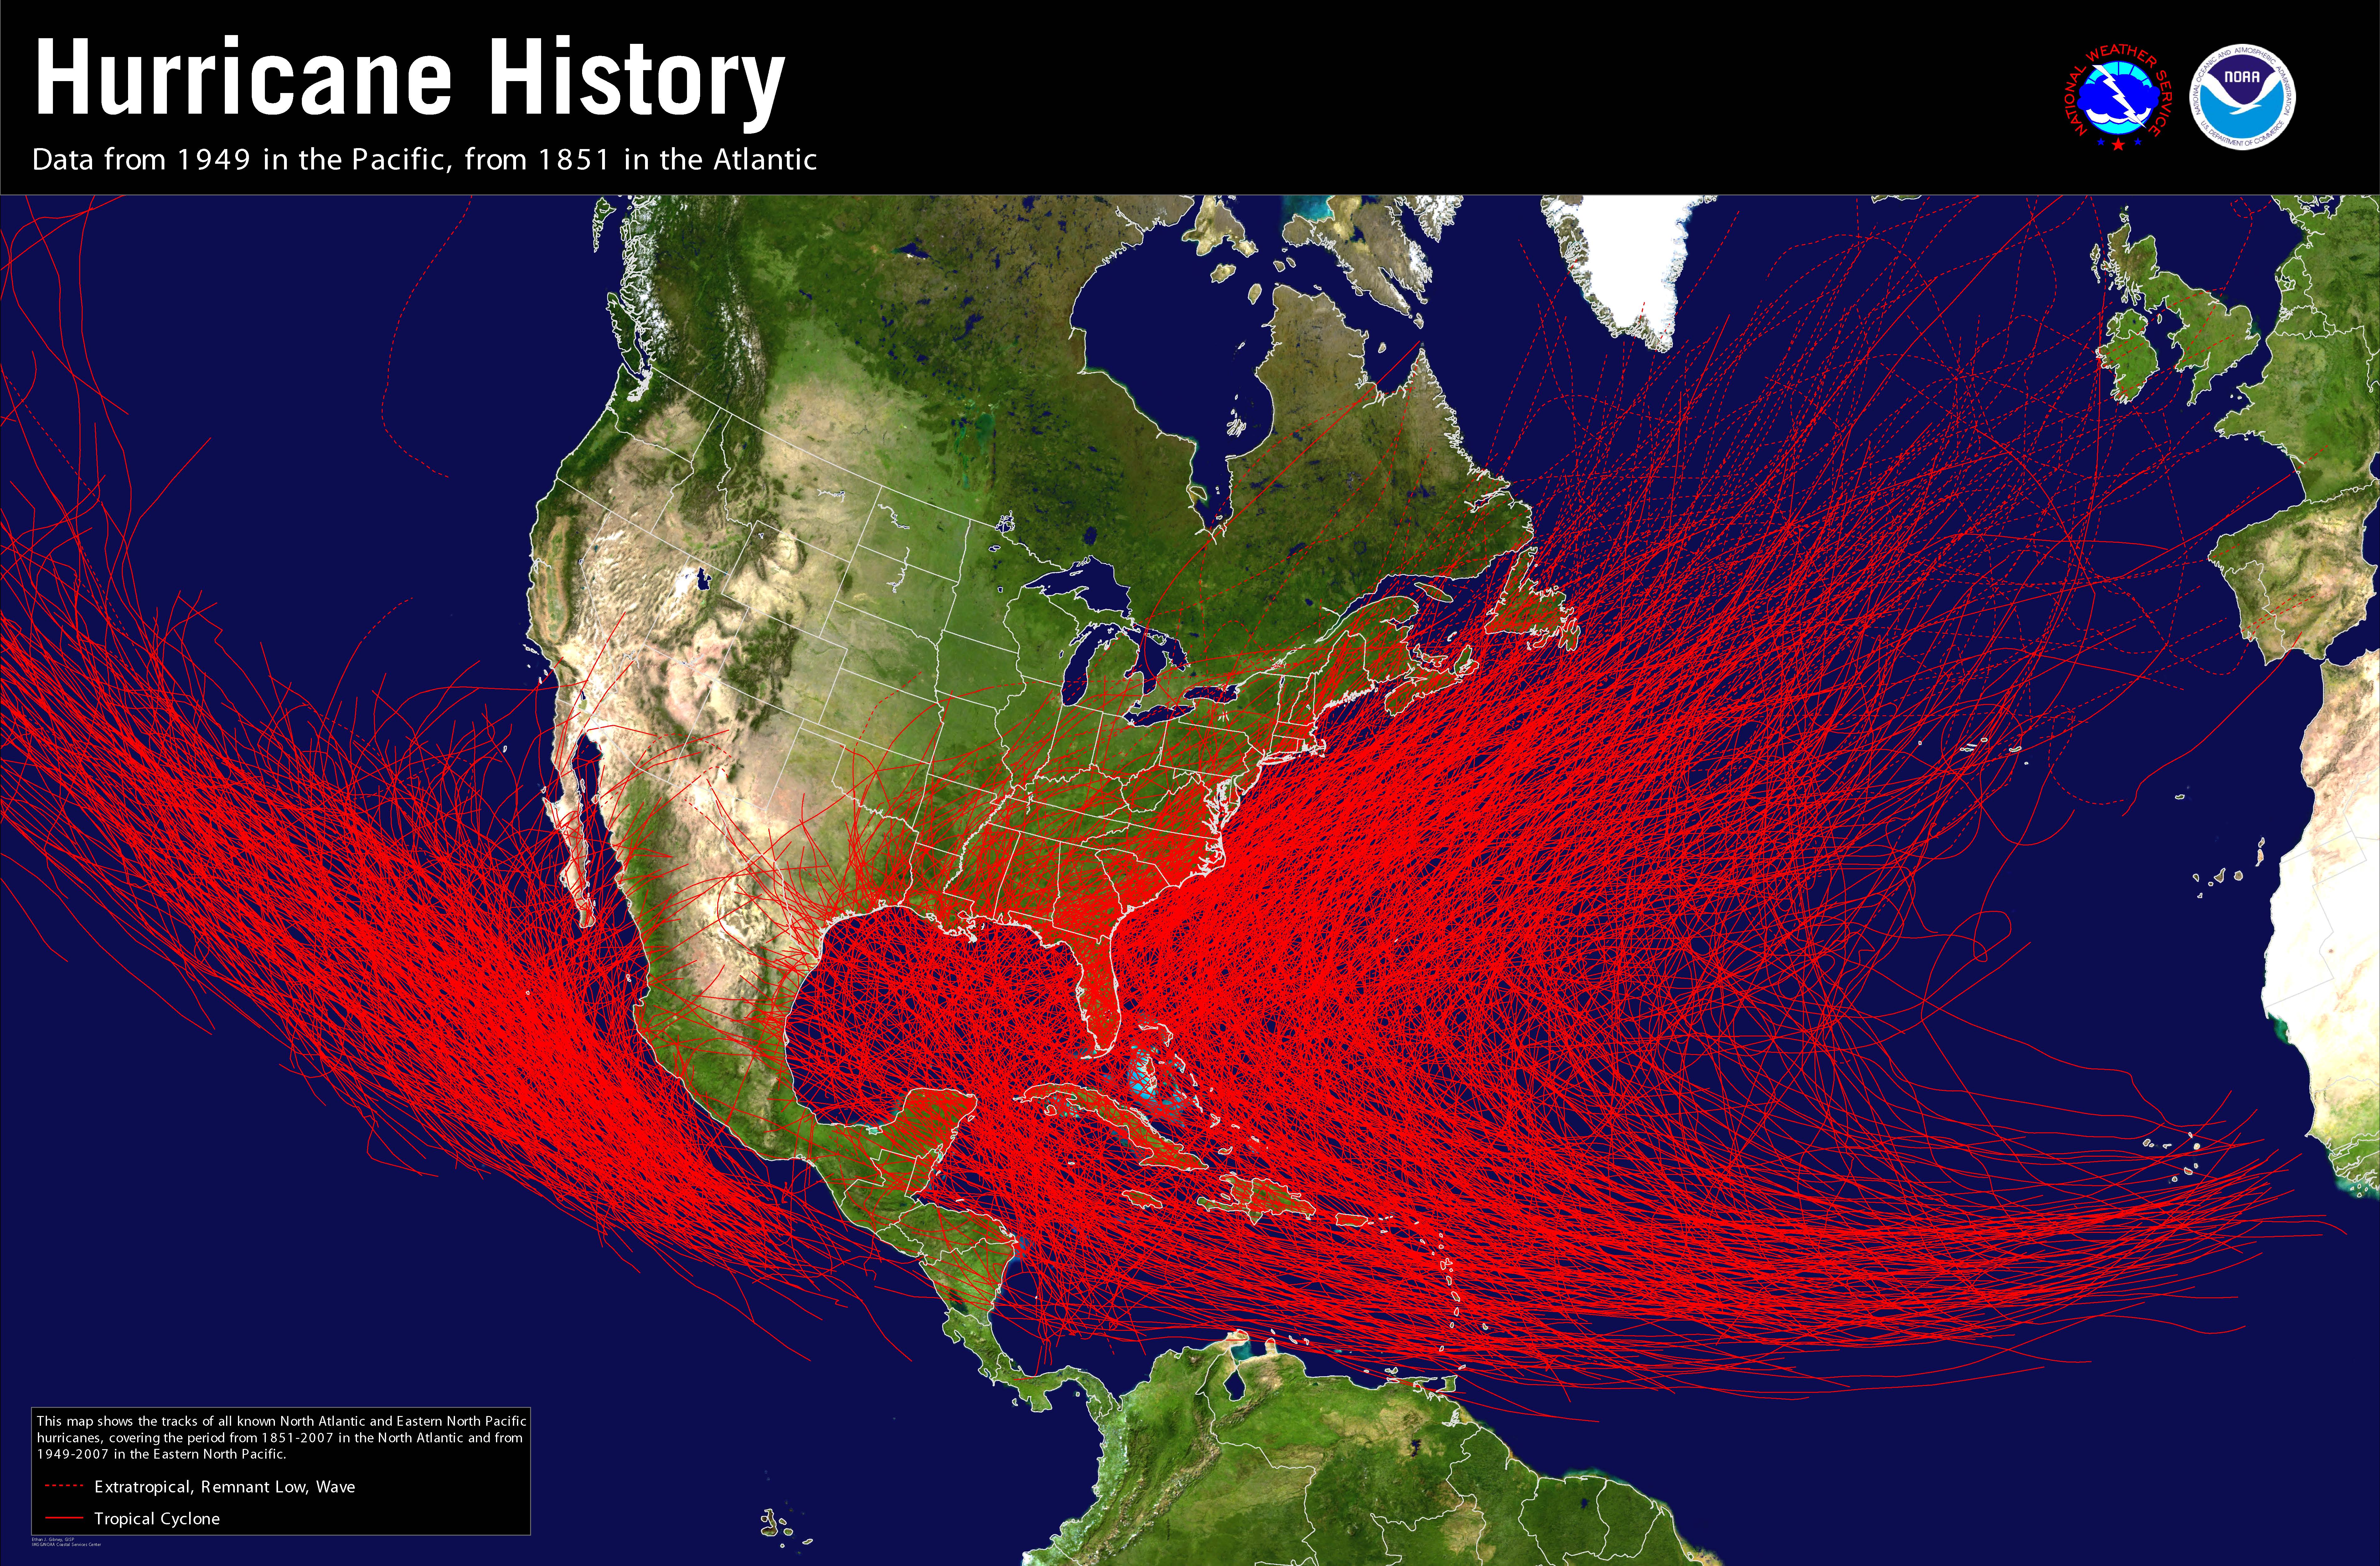
![[Tropical Cyclone History Map for Atlantic and Eastern Pacific]](https://webarchive.library.unt.edu/eot2008/20080916062319im_/http://www.nhc.noaa.gov/gifs/1851_2007_tc_sm.jpg)
Figure 1a. All North Atlantic and Eastern North Pacific tropical cyclones
Download high resolution jpg – Download very high resolution pdf (70MB)
![[Hurricane History Map for Atlantic and Eastern Pacific]](https://webarchive.library.unt.edu/eot2008/20080916062319im_/http://www.nhc.noaa.gov/gifs/1851_2007_hurr_sm.jpg)
Figure 1b. All North Atlantic and Eastern North Pacific hurricanes
(at least Category 1 on the Saffir-Simpson Hurricane Scale)
Download high resolution jpg – Download very high resolution pdf (70MB)
![[Major Hurricane History Map for Atlantic and Eastern Pacific]](https://webarchive.library.unt.edu/eot2008/20080916062319im_/http://www.nhc.noaa.gov/gifs/1851_2007_mjrhurr_sm.jpg)
Figure 1c. All North Atlantic and Eastern North Pacific major hurricanes
(at least Category 3 on the Saffir-Simpson Hurricane Scale)
Download high resolution jpg – Download very high resolution pdf (70MB)
![[Graph of Tropical Cyclone Activity in the Atlantic Basin]](https://webarchive.library.unt.edu/eot2008/20080916062319im_/http://www.nhc.noaa.gov/gifs/atlhist_lowres_sm.gif)
Figure 2. Bars depict number of named systems (open/yellow),
hurricanes (hatched/green), and category 3 or greater (solid/red), 1886-2004
Download hires image
![[Map of 1950-2007 U.S. Landfalling Hurricanes]](https://webarchive.library.unt.edu/eot2008/20080916062319im_/http://www.nhc.noaa.gov/gifs/hurr-uslandfalling-1950-2007_sm.jpg)
Figure 3. 1950-2007 U.S. Landfalling Hurricanes
(Courtesy of NCDC)
![[Map of 1900-2007 Hurricane Strikes by U.S. counties/parishes]](https://webarchive.library.unt.edu/eot2008/20080916062319im_/http://www.nhc.noaa.gov/gifs/strikes_us_sm.jpg)
Figure 4. 1900-2007 U.S. Hurricane Strikes
![[Map of 1900-2007 Hurricane Strikes by U.S. counties/parishes (West Gulf)]](https://webarchive.library.unt.edu/eot2008/20080916062319im_/http://www.nhc.noaa.gov/gifs/strikes_wgulf_sm.jpg)
Figure 5. 1900-2007 U.S. Hurricane Strikes - West Gulf
![[Map of 1900-2007 Hurricane Strikes by U.S. counties/parishes (East Gulf)]](https://webarchive.library.unt.edu/eot2008/20080916062319im_/http://www.nhc.noaa.gov/gifs/strikes_egulf_sm.jpg)
Figure 6. 1900-2007 U.S. Hurricane Strikes - East Gulf
![[Map of 1900-2007 Hurricane Strikes by U.S. counties/parishes (Southeast)]](https://webarchive.library.unt.edu/eot2008/20080916062319im_/http://www.nhc.noaa.gov/gifs/strikes_se_sm.jpg)
Figure 7. 1900-2007 U.S. Hurricane Strikes - Southeast
![[Map of 1900-2007 Hurricane Strikes by U.S. counties/parishes (Mid-Atlantic)]](https://webarchive.library.unt.edu/eot2008/20080916062319im_/http://www.nhc.noaa.gov/gifs/strikes_midatl_sm.jpg)
Figure 8. 1900-2007 U.S. Hurricane Strikes - Mid-Atlantic
![[Map of 1900-2007 Hurricane Strikes by U.S. counties/parishes (Northeast)]](https://webarchive.library.unt.edu/eot2008/20080916062319im_/http://www.nhc.noaa.gov/gifs/strikes_ne_sm.jpg)
Figure 9. 1900-2007 U.S. Hurricane Strikes - Northeast
Comments and questions should be addressed to:
Colin McAdie
Technical Support Branch, TPC
National Hurricane Center
11691 SW 17th St.
Miami, FL 33165-2149
|


![[graph of average cumulative number of Atlantic basin systems per year]](https://webarchive.library.unt.edu/eot2008/20080916062319/http://www.nhc.noaa.gov/gifs/pastprofileAT.gif) Figure 1.
Figure 1.![[graph of average cumulative number of Eastern Pacific basin systems per year]](https://webarchive.library.unt.edu/eot2008/20080916062319/http://www.nhc.noaa.gov/gifs/pastprofileEP.gif) Figure 2.
Figure 2.
![[Tropical Cyclone History Map for Atlantic and Eastern Pacific]](https://webarchive.library.unt.edu/eot2008/20080916062319/http://www.nhc.noaa.gov/gifs/1851_2007_tc.jpg)
![[Hurricane History Map for Atlantic and Eastern Pacific]](https://webarchive.library.unt.edu/eot2008/20080916062319/http://www.nhc.noaa.gov/gifs/1851_2007_hurr.jpg)
![[Major Hurricane History Map for Atlantic and Eastern Pacific]](https://webarchive.library.unt.edu/eot2008/20080916062319/http://www.nhc.noaa.gov/gifs/1851_2007_mjrhurr.jpg)
![[Graph of Tropical Cyclone Activity in the Atlantic Basin]](https://webarchive.library.unt.edu/eot2008/20080916062319/http://www.nhc.noaa.gov/gifs/atlhist_lowres.gif)
![[Map of 1950-2007 U.S. Landfalling Hurricanes]](https://webarchive.library.unt.edu/eot2008/20080916062319/http://www.nhc.noaa.gov/gifs/hurr-uslandfalling-1950-2007.jpg)
![[Map of 1900-2007 Hurricane Strikes by U.S. counties/parishes]](https://webarchive.library.unt.edu/eot2008/20080916062319/http://www.nhc.noaa.gov/gifs/strikes_us.jpg)
![[Map of 1900-2007 Hurricane Strikes by U.S. counties/parishes (West Gulf)]](https://webarchive.library.unt.edu/eot2008/20080916062319/http://www.nhc.noaa.gov/gifs/strikes_wgulf.jpg)
![[Map of 1900-2007 Hurricane Strikes by U.S. counties/parishes (East Gulf)]](https://webarchive.library.unt.edu/eot2008/20080916062319/http://www.nhc.noaa.gov/gifs/strikes_egulf.jpg)
![[Map of 1900-2007 Hurricane Strikes by U.S. counties/parishes (Southeast)]](https://webarchive.library.unt.edu/eot2008/20080916062319/http://www.nhc.noaa.gov/gifs/strikes_se.jpg)
![[Map of 1900-2007 Hurricane Strikes by U.S. counties/parishes (Mid-Atlantic)]](https://webarchive.library.unt.edu/eot2008/20080916062319/http://www.nhc.noaa.gov/gifs/strikes_midatl.jpg)
![[Map of 1900-2007 Hurricane Strikes by U.S. counties/parishes (Northeast)]](https://webarchive.library.unt.edu/eot2008/20080916062319/http://www.nhc.noaa.gov/gifs/strikes_ne.jpg)