Tropospheric Ozone Impacts Global Climate Warming
|
|
In the first global assessment of the impact of ozone on climate warming, scientists at the NASA Goddard Institute for Space Studies (GISS), New York, evaluated how ozone in the lowest part of the atmosphere (the troposphere) changed temperatures over the past 100 years. Using the best available estimates of global emissions of gases that create ozone, the GISS computer model study reveals how much this single air pollutant and greenhouse gas has contributed to warming in specific regions of the world. Ozone was responsible for one-third to half of the observed warming trend in the Arctic during winter and spring, according to the new research. Ozone is transported from the industrialized countries in the Northern Hemisphere to the Arctic quite efficiently during these seasons. The findings will be published soon in the American Geophysical Union's Journal of Geophysical Research-Atmospheres. The impact of ozone air pollution on climate warming is difficult to pinpoint because, unlike other greenhouse gases such as carbon dioxide, ozone does not last long enough in the lower atmosphere to spread uniformly around the globe. Its warming impact is much more closely tied to the region it originated from. To capture this complex picture, the GISS scientists used a suite of three-dimensional computer models that starts with data on ozone sources and then tracks how ozone chemically evolved and moved around the world over the past century. The research was supported by NASA's Atmospheric Chemistry Modeling and Analysis Program.
|
|
|
|
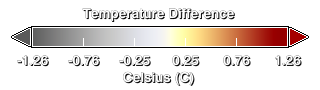
This animation shows anomalous global temperature averages from December through May in the years 1880 through 2000.
Duration: 35.0 seconds
Available formats:
720x486 (29.97 fps)
Frames
320x216
PNG
65 KB
160x80
PNG
24 KB
720x480 (29.97 fps)
MPEG-2
30 MB
644x289
Frames
80x40
PNG
7 KB
640x480 (29.97 fps)
MPEG-4
8 MB
640x480 (29.97 fps)
MPEG-1
9 MB
320x240 (29.97 fps)
MPEG-1
4 MB
How to play our movies
|
|
This product is available through our Web Map Service.
Click here to learn more.
|
|

|
|
Temperature Colorbar
Available formats:
320 x 90
PNG
8 KB
|
|
|
|
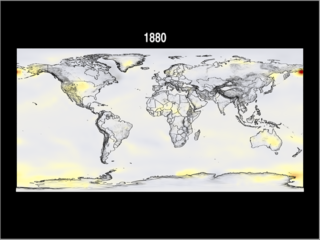
1880 - This image shows a decadal winter and spring seasonal average between December through May in the years 1880 through 1889.
Available formats:
2560 x 1920
TIFF
2 MB
320 x 240
PNG
65 KB
|
|
|
|
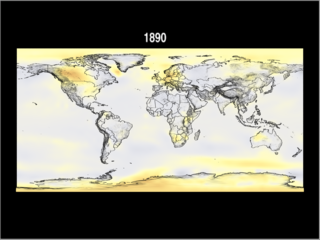
1890 - This image shows a decadal winter and spring seasonal average between 1890 and 1899. Both polar regions are slightly above normal temperatures.
Available formats:
2560 x 1920
TIFF
2 MB
320 x 240
PNG
67 KB
|
|

|
|
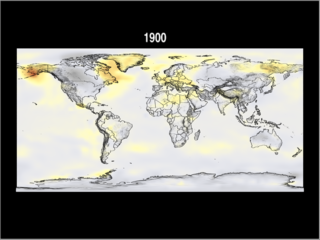
1900 - This image shows a decadal winter and spring seasonal average between 1900 and 1909. Notice both polar regions are at or below average temperatures.
Available formats:
2560 x 1920
TIFF
3 MB
320 x 240
PNG
68 KB
|
|
|
|
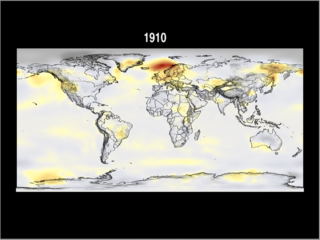
1910 - This image shows a decadal winter and spring seasonal average between 1910 and 1919. Notice both polar regions are at or below average temperatures.
Available formats:
2560 x 1920
TIFF
3 MB
320 x 240
PNG
69 KB
|
|
|
|
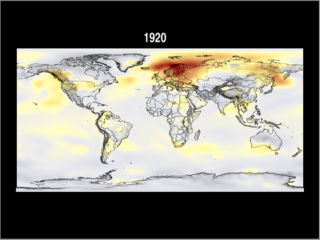
1920 - This decadal winter and spring seasonal average shows higher than normal temperatures in Europe, but the poles are both normal.
Available formats:
2560 x 1920
TIFF
3 MB
320 x 240
PNG
71 KB
|
|

|
|
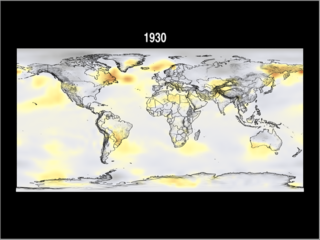
1930 - This decadal winter and spring seasonal average shows both polar regions are at or below average temperatures.
Available formats:
2560 x 1920
TIFF
3 MB
320 x 240
PNG
71 KB
|
|
|
|
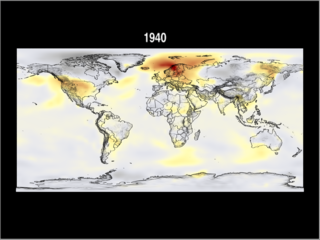
1940 - This decadal winter and spring seasonal average
shows warmer then normal temperatures over Europe, but both polar areas record normal temperatures.
Available formats:
2560 x 1920
TIFF
3 MB
320 x 240
PNG
70 KB
|
|
|
|
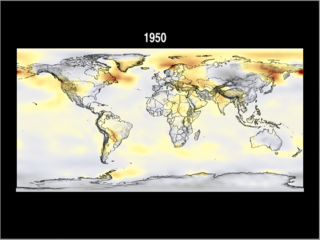
1950 - This decadal winter and spring seasonal average exposes slightly higher then normal temperatures in the Northern Hemisphere.
Available formats:
2560 x 1920
TIFF
3 MB
320 x 240
PNG
72 KB
|
|
|
|
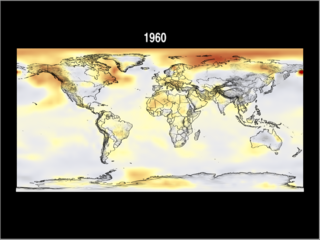
1960 - This decadal winter and spring seasonal average illustrates the warmer then normal average temperatures in the northern latitudes.
Available formats:
2560 x 1920
TIFF
3 MB
320 x 240
PNG
72 KB
|
|

|
|
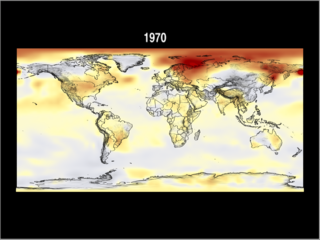
1970 - This decadal winter and spring seasonal average illustrates warmer then normal average temperatures in the northern latitudes.
Available formats:
2560 x 1920
TIFF
3 MB
320 x 240
PNG
73 KB
|
|
|
|
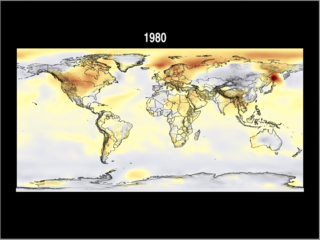
1980 - This decadal winter and spring seasonal average illustrates slightly warmer then normal average temperatures in the northern latitudes.
Available formats:
2560 x 1920
TIFF
3 MB
320 x 240
PNG
72 KB
|
|

|
|
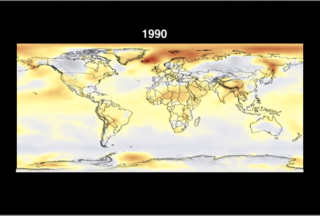
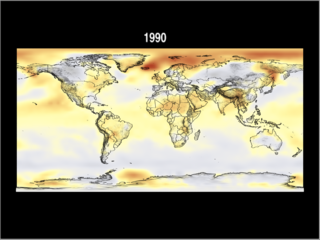
1990 - This decadal winter and spring seasonal average illustrates warmer then normal average temperatures in the northern latitudes.
Available formats:
2560 x 1920
TIFF
3 MB
320 x 240
PNG
73 KB
|
|
|
Back to Top
|


