|
|
 |
Monthly Sea Ice Climatology, 1979-2002 (WMS)
|
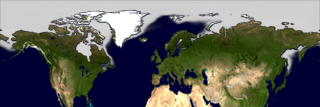
Sea ice is frozen seawater floating on the surface of the ocean. Some sea ice is permanent, persisting from year to year, and some is seasonal, melting and refreezing from season to season. Because the extent of the sea ice is important both for the Arctic marine ecology and for the role it plays in the Earth's climate, understanding the variation of this extent during the year and from year-to-year is vital. The first step in understanding the behavior of the sea ice is to calculate the average behavior of the sea ice over a single year. This behavior, called the climatology, is calculated by averaging the sea ice concentration over each month of a long period, in this case from October 1978 through September 2002. This animation shows the 23-year average sea ice concentration in the northern hemisphere for each particular month of the year. Generally, the minimum extent of sea ice occurs in September, and the maximum occurs in March.
|
|
|
|
This animation shows the mean sea ice concentration in the northern hemisphere. Each frame represents the mean value of a particular month from all years between 1979 and 2002.
Duration: 3.0 seconds
Available formats:
600x192 (29.97 fps)
MPEG-2
2 MB
600x192 (29.97 fps)
MPEG-1
2 MB
320x107
PNG
139 KB
80x40
PNG
15 KB
160x80
PNG
58 KB
How to play our movies
|
|
This product is available through our Web Map Service.
Click here to learn more.
|
|
|
|
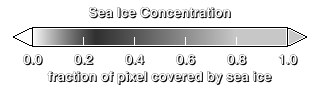
Color bar for the sea ice concentration.
Available formats:
320 x 90
PNG
1 KB
|
|
|
Back to Top
|
|
|
|


