|
|
 |
ViSBARD: Insights into the Sun-Earth Connection
|
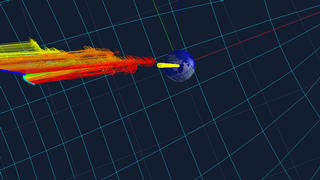
ViSBARD (Visual System for Browsing, Analysis, and Retrieval of Data) is a data analysis application that brings together measurements from collections of spacecraft near the Earth or throughout the heliosphere In this visualization created from ViSBARD screenshots, we see the magnetic field as measured from six different satellites. The position of each spacecraft is marked by a small color glyph (ACE = yellow, Cluster = dark blue, Geotail = green, GOES 10 = red, Polar = light blue, Wind = purple). The direction of the arrow signifies the direction of the magnetic field while the color represents the intensity (red being the highest, blue the lowest). The magnetic pole of the Earth is in yellow, and it rotates properly as the animation proceeds. This view of the magnetic storm shows highly disturbed fields at geosynchronous orbit (GOES), many crossings of the 'magnetotail current sheet' where the field changes sign and points at the opposite pole of the Earth, close encounters with the Earth (large red fields that are truncated to keep the arrows from becoming huge), and the entry from the back of the picture of Wind and Geotail through the bow shock (wire-frame) and magnetopause (sometimes visible as a transparent surface).
|
|

|
|
Multi-mission view of October 7, 2002, solar storm.
Duration: 43.0 seconds
Available formats:
1280x720 (30 fps)
Frames
512x288 (30 fps)
MPEG-1
5 MB
1280x720 (29.97 fps)
MPEG-2
93 MB
320x180
JPEG
9 KB
320x180
JPEG
9 KB
How to play our movies
|
|
|
|
We see the Earth to get a sense of the scale in this region.
Available formats:
1280 x 720
TIFF
223 KB
160 x 80
PNG
8 KB
320 x 180
JPEG
11 KB
80 x 40
PNG
3 KB
|
|
|
|
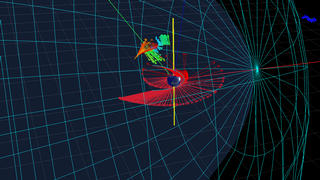
The Polar spacecraft (light blue) makes a close pass to
by the Earth and we see the magnetic field direction changes dramatically through
this region. Geotail appears in the upper right-hand corner. Note the very disturbed fields measured by GOES-10 (above Polar in the image) that indicated a strong storm disturbance.
Available formats:
1280 x 720
TIFF
144 KB
160 x 80
PNG
13 KB
320 x 180
JPEG
16 KB
|
|
|
|
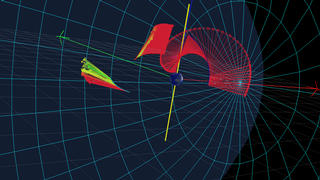
Cluster passes through the cusp in the Earths magnetic field over the north
magnetic pole and we see another dramatic change in the measured magnetic fields.
Available formats:
1280 x 720
TIFF
153 KB
160 x 80
PNG
12 KB
320 x 180
JPEG
14 KB
|
| Animation Number: | 2862 |
| Animator: | Tom Bridgman (SVS) (Lead) |
| Completed: | 2003-12-12 |
| Scientist: | Aaron Roberts (NASA/GSFC) |
| Instruments: | ACE
|
| | Cluster |
| | GOES-10 |
| | Geotail |
| | Polar |
| | Wind |
| Data Collected: | 2002-10-07T00:04:35 - 2002-10-10T23:59:51 |
| Series: | ViSBARD |
Keywords:
SVS
>> HDTV
SVS
>> Magnetosphere
DLESE
>> Space science
SVS
>> ViSBARD
|
|
Please give credit for this item to
NASA/Goddard Space Flight Center
Scientific Visualization Studio, and Ryan Boller (NASA/GSFC) |
|
Back to Top
|
|
|
|

