Global TRMM Rainmap 2005
|
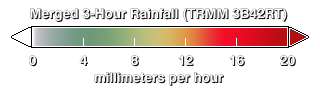
This is a three-hour global rainmap from January 1, 2005 through December 31, 2005, as compiled by the TRMM satellite's Multi-satellite Precipation Analysis. The TRMM Multi-satellite Precipitation Analysis produces three hourly rain rates at 0.250 latitude by 0.250 longitude grid covering 500S to 500N. The input data for this merged product include a merged intercalibrated microwave-only product (3B40RT) and an Infrared rain product that is calibrated using microwave rain rates (3B41RT). Currently, 3B40RT is generated using rain rate estimates from microwave measurements from the TRMM sensors and the Special Sensor Microwave Imagers on board the DMSP satellites using the Goddard Profiling Algorithm (GPROF). 3B41RT is based on infrared measurements from geostationary satellites that are calibrated using microwave rain estimates. The 3B42RT estimate consists of the merged microwave estimate within the 3 hourly 0.25 degree space/time grid when available, and the calibrated IR rain rates otherwise.
|
|
|
|
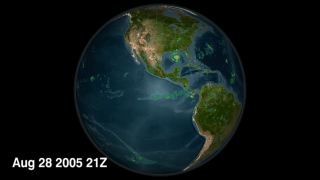
This animation shows TRMM's rainfall data every 3 hours for the 2005 year.
Hurricane Katrina is clearly visible in the Gulf of Mexico.
Duration: 6.5 minutes
Available formats:
1280x720 (60 fps)
Frames
1280x720 (29.97 fps)
MPEG-4
42 MB
512x288 (30 fps)
MPEG-1
48 MB
3840x2160
TIFF
4 MB
320x180
PNG
131 KB
160x80
PNG
33 KB
80x40
PNG
9 KB
1280x720 (29.97 fps)
MPEG-4
21 MB
How to play our movies
|
|
|
|
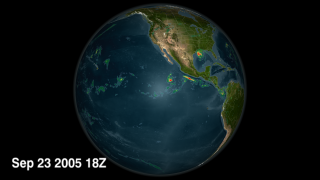
Hurricane Rita is threatening the Gulf Coast on September 25, 2005.
Available formats:
3820 x 2160
TIFF
4 MB
320 x 180
PNG
131 KB
|
|
|
|
Colorbar
Available formats:
320 x 90
PNG
13 KB
|
|
|
Back to Top
|

