NASA Scientists Research Tropical Cyclones
|
|
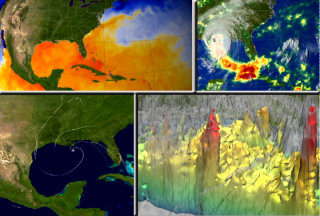
From hot towers to phytoplankton blooms, NASA's cutting-edge hurricane research has been revealing never-before-seen aspects of these giant storms for over a decade. The past three years have seen great progress in the areas of intensity monitoring and 3-D modeling of hurricanes. In 2006, scientists at NASA and other institutions have more tools than ever to study these storms using the very latest in ground, air, and space-based technology. The top left window shows sea surface temperature and clouds. Orange and red colors represent ocean temperatures at 82 degrees Fahrenheit or higher. This is the temperature required for hurricanes to form. The bottom left window shows wind analysis model data from NASA's Modeling, Analysis, and Prediction (MAP '05) program. The top right window shows Rainfall Accumulation for Hurricane Katrina from the TRMM spacecraft. The bottom right window shows Energy-releasing deep convective clouds (to 16 km) in the eyewall of Hurricane Katrina, called 'Hot Towers', on August 28 occurred while the storm was intensifying to a category 5 classification.
|
|
|
|
NASA researchers studied several elements during Hurricane Katrina in 2005.
The top left window shows sea surface temperature and clouds. The bottom left window shows wind analysis model data. The top right window shows Rainfall Accumulation. The bottom right window shows Hurricane Katrina's Hot Towers.
Duration: 16.0 seconds
Available formats:
720x486 (29.97 fps)
Frames
320x216
PNG
340 KB
160x80
PNG
66 KB
80x40
PNG
17 KB
720x480 (29.97 fps)
MPEG-2
14 MB
640x480 (29.97 fps)
MPEG-4
12 MB
640x480 (29.97 fps)
MPEG-1
5 MB
320x240 (29.97 fps)
MPEG-1
4 MB
How to play our movies
|
|
|
|
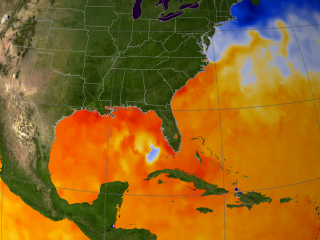
Sea surface temperature on Aug 29, 2005. Orange and red depict regions where the conditions are suitable for hurricanes to form. For more information go to
SVS animation 3225.
Available formats:
2560 x 1920
TIFF
6 MB
320 x 240
PNG
122 KB
|
|
|
|
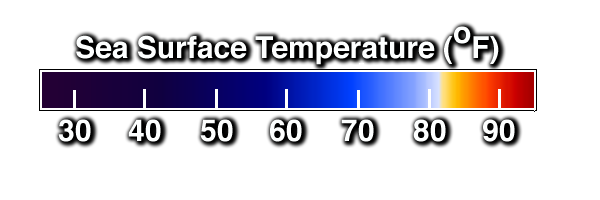
Color bar for sea surface temperatures in degrees Fahrenheit: blues are less than 80 , white is about 82, yellows and reds are above 82
Available formats:
600 x 200
PNG
27 KB
|
|

|
|
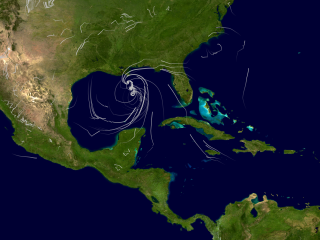
This animation shows rain accumulation from Hurricane Katrina from August 23 through 30, 2005 based on data from the Tropical Rainfall Measuring Mission (TRMM) Multisatellite Precipitation Analysis. For more information go to
SVS animation 3221.
Available formats:
2560 x 1920
TIFF
15 MB
320 x 240
PNG
154 KB
|
|

|
|
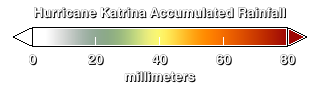
The legend for rainfall accumulation from the Tropical Rainfall Measuring Mission (TRMM) Multisatellite Precipitation Analysis
Available formats:
320 x 90
PNG
10 KB
|
|

|
|
This animation generates white static flow fields from NASA's Modeling, Analysis, and Prediction (MAP '05) wind analysis data. For more information go to SVS aninmation 3359.
Available formats:
2560 x 1920
TIFF
4 MB
320 x 240
PNG
78 KB
|
|

|
|
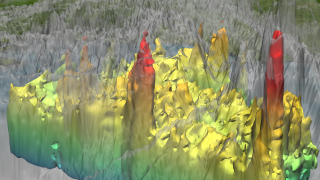
Energy-releasing deep convective clouds (to 16 km) in the eyewall of Hurricane Katrina on August 28 occurred while the storm was intensifying to a category 5 classification. For more information go to SVS animation 3253.
Available formats:
1280 x 720
TIFF
1 MB
320 x 180
PNG
105 KB
|
|

|
|
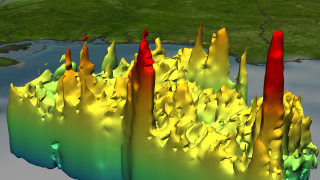
TRMM is the only satellite that can provide rain structure information over open oceans. Remove the clouds and two deep towers are observed. The tower in the center is located in the hurricane's eye wall.
Available formats:
1280 x 720
TIFF
1 MB
320 x 180
PNG
91 KB
|
|

|
|
Hurricane Katrina's vertical rain structure in kilometers. The highest towers are shown in red.
Available formats:
320 x 90
PNG
8 KB
|
|
|
Back to Top
|

