THEMIS Mission and Substorm Simulation
|
|
This visualization combines simulations of the THEMIS (Time History of Events and Macroscale Interactions during Substorms) mission orbits with a GGCM (Geospace General Circulation Model) simulation. It illustrates how the five THEMIS satellites will work together to detect substorm events in the magnetosphere. One goal of the THEMIS mission is to test how these substorm events are related to the formation of the aurora. This mission consists of five identical spacecraft (usually designated P1, P2, P3, P4 and P5) with orbits aligned so they reach their apogee along the same line from the Earth. This alignment remains fixed in space so as the Earth moves around the Sun, the constellation of spacecraft will extend on the nightside of the Earth in winter to sample the Earth's magnetosphere, and on the dayside of the Earth in summer to sample the incoming solar wind. This way they can better map the geospace environment. Probes P1 and P2 are called the 'outer probes' and P3, 4, and 5 are the 'inner probes'. P3 and P4 share the same orbit. The outer probes will detect the onset of the substorm, while the inner probes will monitor the Earthward plasma flows from the event. For more information on the GGCM model, visit the Community Coordinated Modeling Center and OpenGGCM.
|
|
|
|
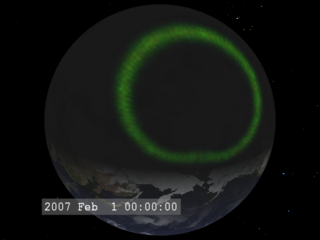
Opening with a view of the aurora borealis, we zoom out to reveal the proposed orbital configuration of the five THEMIS satellites and fade in a GGCM magnetosphere model.
Duration: 23.0 seconds
Available formats:
320x240 (30 fps)
MPEG-1
3 MB
640x480 (30 fps)
MPEG-1
16 MB
720x480 (30 fps)
MPEG-2
18 MB
1280x720 (30 fps)
MPEG-2
50 MB
720x480 (29.97 fps)
Frames
1280x720 (29.97 fps)
Frames
320x240
JPEG
19 KB
160x80
PNG
29 KB
80x40
PNG
7 KB
1280x720 (29.97 fps)
MPEG-2
49 MB
640x480 (29.97 fps)
MPEG-4
23 MB
1280x720 (29.97 fps)
MPEG-4
22 MB
How to play our movies
|
|
|
|
We open with a view of a (simulated) aurora.
Available formats:
2560 x 1920
TIFF
2 MB
320 x 240
PNG
41 KB
|
|

|
|
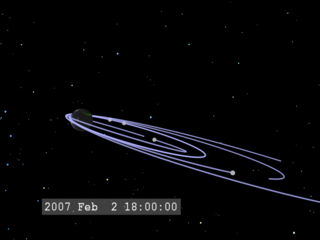
Pulling out further from the Earth, we see the orbits of the five THEMIS spacecraft (P3 and P4 share an orbit).
Available formats:
2560 x 1920
TIFF
1 MB
320 x 240
PNG
50 KB
|
|
|
|
The THEMIS constellation moves in a set of four orbits of different eccentricies to sample the geospace region around the Earth. In winter, the spacecraft reach their apogee on the nightside of the Earth (the Sun is to the left in this view). The spacecraft are identified as P1, P2, P3, P4, and P5, in order of increasing distance from the Earth.
Available formats:
2560 x 1920
TIFF
538 KB
320 x 240
PNG
20 KB
|
|

|
|
The color of the spacecraft change to purple to illustrate they are within five hours of conjunction (all five spacecraft aligned close to the Earth-Sun line).
Available formats:
2560 x 1920
TIFF
419 KB
320 x 240
PNG
14 KB
|
|

|
|
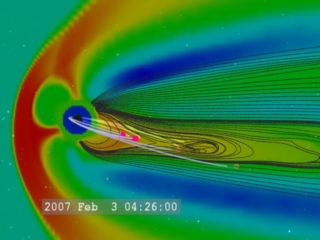
Now the GGCM data fades into view. The black lines represent the Earth's magnetic field stretched behind the Earth due to the incoming solar wind. The color represents plasma pressure (red is high, blue is low). The blue region immediately around the Earth is actually a 'hole' in the model where the simulation does not apply.
Available formats:
2560 x 1920
TIFF
3 MB
320 x 240
PNG
76 KB
|
|

|
|
In this view of the plasma pressure (colors) and the magnetic field lines (black), we see a substorm event.
Available formats:
2560 x 1920
TIFF
3 MB
320 x 240
PNG
83 KB
|
|

|
|
The substorm event continues to form (on the timescale of minutes) near the P2 spacecraft.
Available formats:
2560 x 1920
TIFF
3 MB
320 x 240
PNG
82 KB
160 x 80
PNG
19 KB
80 x 40
PNG
6 KB
|
|

|
|
After the reconnection event, the magnetic field lines pull plasma earthward, where they may contribute to the structure of the aurora. THEMIS will resolve where in this volume of space the substorm trigger is located and how the substorm evolves in the few minutes after onset.
Available formats:
2560 x 1920
TIFF
3 MB
320 x 240
PNG
82 KB
|
|
|
Back to Top
|

