Chlorine Monoxide from new Microwave Limb Sounder on Aura (WMS)
|
Chlorine monoxide (ClO) in the atmosphere as measured by the Microwave Limb Sounder (MLS) instrument on NASA's Aura satellite. MLS can simultaneously measure several trace gases and ozone-destroying chemicals in the upper troposphere and photosphere. In this series of animations we present chlorine monoxide (ClO), hydrogen chloride (HCl), nitric acid (HNO3), ozone (O3), water vapor (H2O) and temperature measurements. These are 'first light' data taken when the MLS was operated for the first time. ClO is a temporary byproduct of the chemical reaction sequence by which chlorine from chlorofluorocarbons (CFCs) destroys ozone.
|
|

|
|
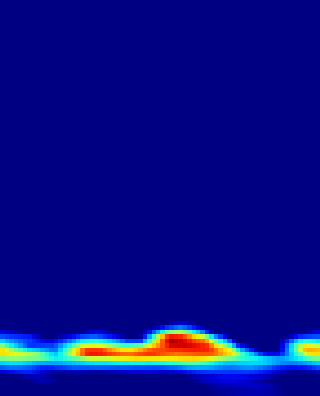
This animation shows chlorine monoxide (ClO) in the atmosphere from August 13 through October 15, 2004. Red represents high concentrations; blue represents low concentrations. The spatial resolution is low: each pixel covers an area of 5 degrees longitude by 2 degrees latitude, so the entire world (except for 1 degree at each pole) is covered by the 72x89 pixel images.
Duration: 1.0 seconds
Available formats:
160x80
PNG
3 KB
320x396
PNG
2 KB
80x40
PNG
2 KB
360x440 (29.97 fps)
MPEG-1
234 KB
How to play our movies
|
|
This product is available through our Web Map Service.
Click here to learn more.
|
|
|
|
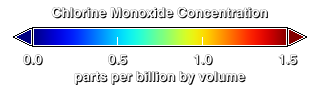
Color scale for chlorine monoxide concentration. Values shown range from 0 to 1.5 ppbv (parts per billion by volume).
Available formats:
320 x 90
PNG
1 KB
|
|
|
Back to Top
|


