Aura/OMI Ozone Hole from September 12, 2004 to November 15,2004
|
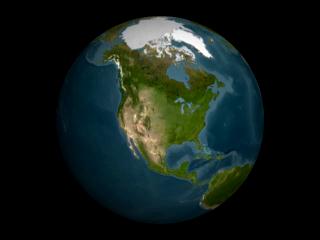
Data from NASA satellites establishes a 40 year record of stratospheric ozone measurements. The stratospheric ozone layer shields life on Earth from harmful solar ultraviolet (UV) radiation. Research shows that excess exposure to UV radiation causes skin cancer and eye problems and impacts plant growth. Global stratospheric ozone has decreased by 3 percent globally between 1980 and 2000 and has thinned by 50 percent over Antarctica in winter and spring. Depletion of the ozone layer allows more UV radiation to reach the Earth's surface. This animation shows the ozone layer blocking harmful UV radiation from the Earth's surface. The hole in the ozone is seen in purple.
|
|
|
|
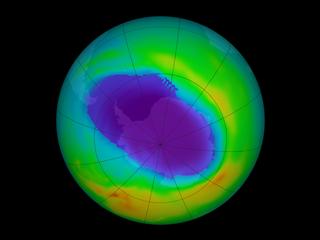
This animation shows the Antarctic ozone from September 12, 2004 to November 15, 2004. The maximum hole occurred on September 22, 2004. Purple areas purple show regions with low ozone and red areas show high ozone levels.
Duration: 28.0 seconds
Available formats:
720x486 (29.97 fps)
Frames
640x480 (29.97 fps)
MPEG-1
11 MB
720x480 (29.97 fps)
MPEG-2
17 MB
320x240
JPEG
6 KB
How to play our movies
|
|
|
|
In 2004, the maximum ozone hole occurred on September 22, 2004.
Available formats:
2560 x 1920
TIFF
2 MB
160 x 80
PNG
23 KB
320 x 240
JPEG
6 KB
80 x 40
PNG
6 KB
|
|

|
|
OMI Ozone ColorBar in Dobson Units
Available formats:
480 x 40
TIFF
72 KB
480 x 40
JPEG
4 KB
|
|
|
Back to Top
|

