Skip all navigation and jump to content Jump to site navigation Jump to section navigation.
NASA Logo - Goddard Space Flight Center + Visit NASA.gov
HOME PROJECTS RESOURCES SEARCH MAP

+ Advanced Search
Home
Home
View Most Recently Released Imagery
View Gallery of Imagery: A topical collection of SVS Imagery
Search Imagery by the keywords assigned to it
Search Imagery by the instruments that supplied data for a visualization product
Search Imagery by the series of visualizations that have been produced
Search Imagery by the scientist providing the data used in a visualization product
Search Imagery by the animator that created the product
Search Imagery by the identification number assigned to the visualization product
See other search options
Learn about the SVS Image Server
  + About the Server
  + Animation List
  + How to Use the Server


  + RSS Feeds
  + Podcasts


  + Opportunities
blank image
Previous Animation
Next Animation
NASA Explains 'Dust Bowl' Drought

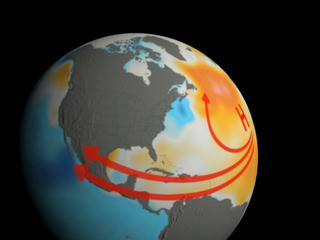
Abnormal sea surface temperatures (SST) in the Pacific and the Atlantic Ocean played a strong role in the 1930s dust bowl drought.

Scientists used SST data acquired from old ship records to create starting conditions for the computer models. They let the model run on its own, driven only by the observed monthly global sea surface temperatures. The model was able to reconstruct the Dust Bowl drought quite closely, providing strong evidence that the Great Plains dry spell originated with abnormal sea surface temperatures.

This sequence shows the warmer than normal SST (red-orange) in that the Atlantic Ocean and colder than normal SST (blues) in the Pacific Ocean, followed by a low level jet stream that shifted and weakened reducing the normal supply of moisture to the Great Plains.


This is the standard definition version of the Dust Bowl Model animation MPEG.    This is the standard definition version of the Dust Bowl Model animation MPEG.
Duration: 9.0 seconds
Available formats:
  320x240 (30 fps) MPEG-1   1 MB
  320x240     JPEG         7 KB
  720x486     Frames
  720x480 (29.97 fps) MPEG-2   3 MB
  640x480 (29.97 fps) MPEG-4   1 MB
  320x240 (30 fps) X-FLV       503 KB
How to play our movies


This is the high resolution still of the precipitation indicated by the model.    This is the high resolution still of the precipitation indicated by the model.

Available formats:
  3000 x 2025     TIFF 6 MB
  150 x 101         JPEG       3 KB
  320 x 216         JPEG       9 KB
  75 x 50             JPEG       1 KB


This is the high resolution still of the precipitation that was observed at the time.    This is the high resolution still of the precipitation that was observed at the time.

Available formats:
  3000 x 2025     TIFF 7 MB
  320 x 216         JPEG     10 KB

Animation Number:10032
Completed:2004-03-18
Animators:Susan Twardy (HTSI) (Lead)
 Greg Shirah (NASA/GSFC)
 Marte Newcombe (GST)
Scientist:Siegfried D. Schubert (NASA/GSFC)
Writer:Rani Chohan (NASA/GSFC)
Goddard TV Tape:G2004-020
Keywords:
SVS >> Byrne
SVS >> Drought
SVS >> Earth Science
SVS >> Gonnelli
SVS >> Sea Surface Temperature
 
 
Please give credit for this item to
NASA/Goddard Space Flight Center Conceptual Image Lab, Scientific Visualization Studio


Back to Top

USA.gov logo - the U.S. Government's official Web portal. + Privacy Policy and Important Notices
+ Reproduction Guidelines
NASA NASA Official:
Content Contact:
Curator: